 |
In order to reasonably simulate the population of the elderly, we generate elderly data according to the population characteristics surveyed by the Taitung county government in July 2022. The surveyed data is based on villages in the county. To arrange policies close to the elderly who need more help, we divide the elderly into three care levels: no assistance, basic assistance required, and high assistance required. We set 5% to 15% of the elderly population to be the ones who require extreme care, 10% to 25% require moderate care, and the rest is the elderly population that requires little care.
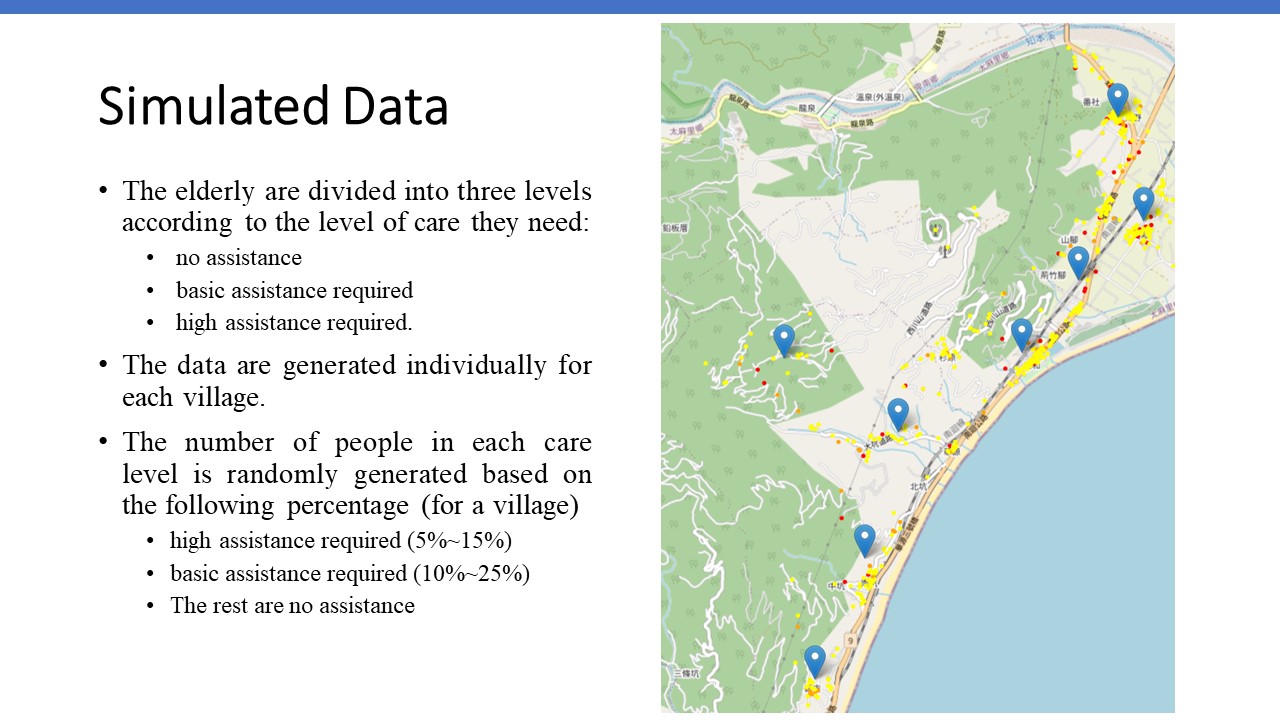
The map on the right side shows the elderly population distribution. The red points indicate the location of the elderly who need extreme care. The orange points are the location of the elderly who require moderate care. The rest elderly are in yellow colors.
|
 IEEE/ICACT20230036 Slide.05
[Big Slide]
[YouTube]