 IEEE/ICACT20230156 Slide.07
[Big Slide]
Oral Presentation
IEEE/ICACT20230156 Slide.07
[Big Slide]
Oral Presentation 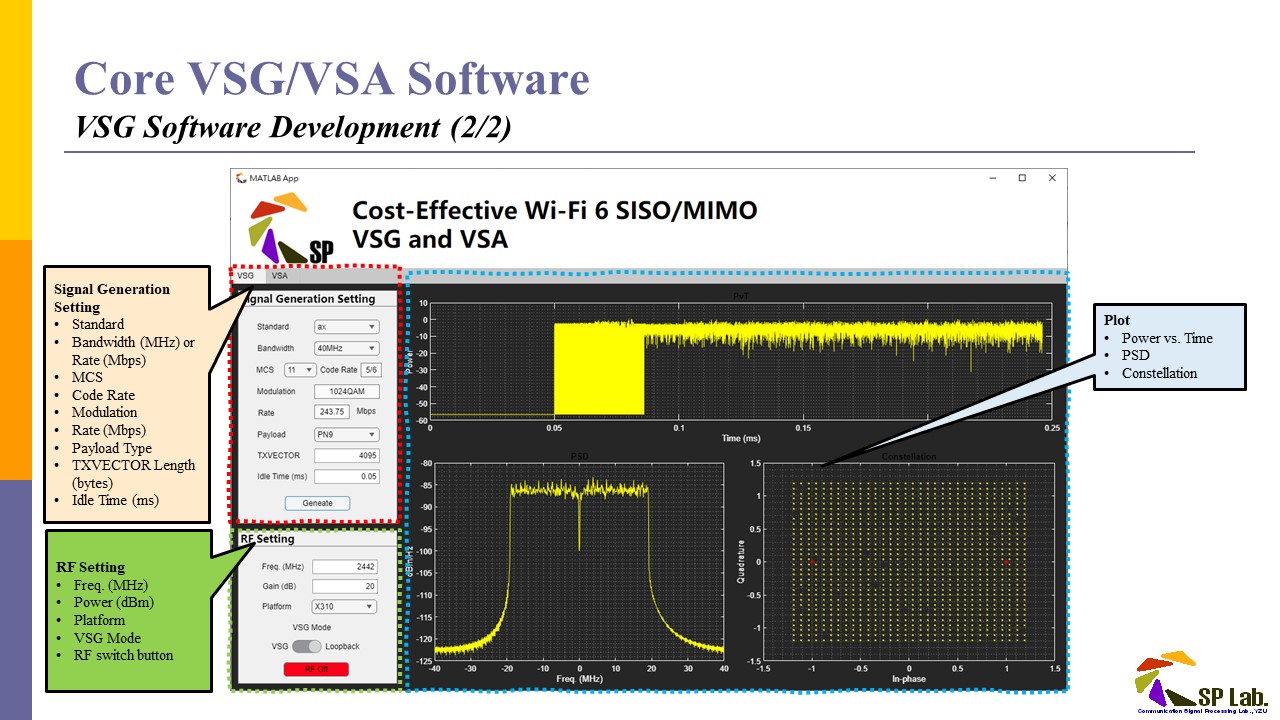
| Virual Oral Presentation Slide by Slide |
|
IEEE/ICACT20230156 Slide.07
[Big Slide]
| Oral Presentation |
|
|
|
The figure shows the graphical user interface (GUI) for users to set the parameters and observe the generated waveform. In the software, there are VSG and VSA tab. In the VSG tab, there are two panels for Signal Generation Setting and RF Setting. And the generated waveform can be observed in power vs. time, PSD, and constellation plots. | |
| [Go to Next Slide] |