 IEEE/ICACT20210244 Slide.08
[Big Slide]
Oral Presentation
IEEE/ICACT20210244 Slide.08
[Big Slide]
Oral Presentation 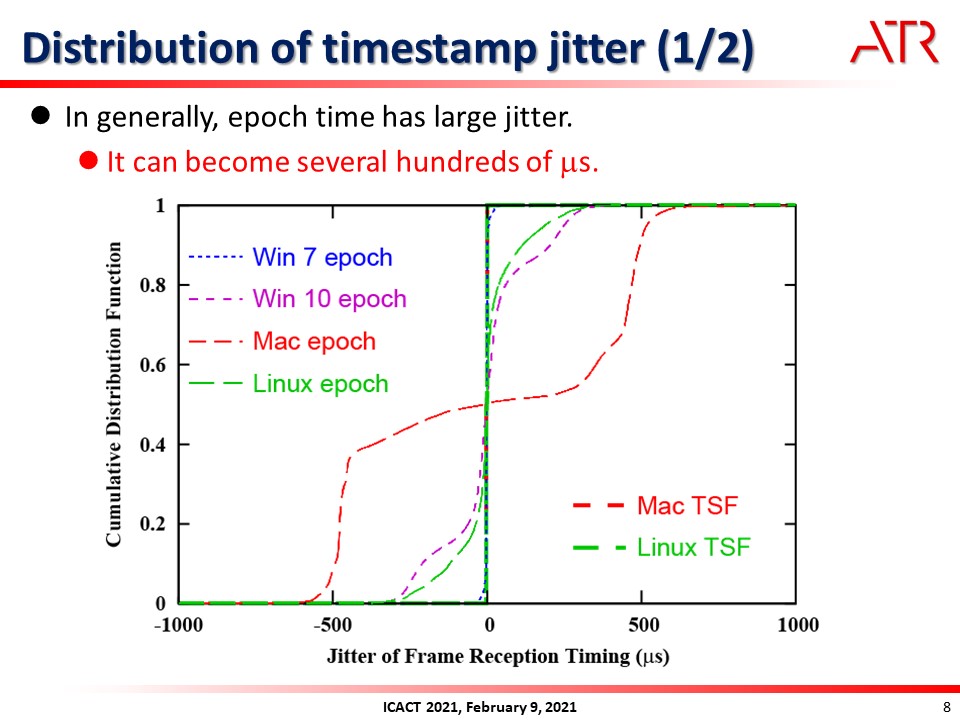
| Virual Oral Presentation Slide by Slide |
|
IEEE/ICACT20210244 Slide.08
[Big Slide]
| Oral Presentation |
|
|
|
This graph shows the cumulative distribution of the timestamp jitter. The horizontal axis shows the jitter, and the vertical axis shows the CDF of the timestamp jitter. As shown in this graph, epoch time has large jitter, and it can become several hundreds of us. | |
| [Go to Next Slide] |