 |
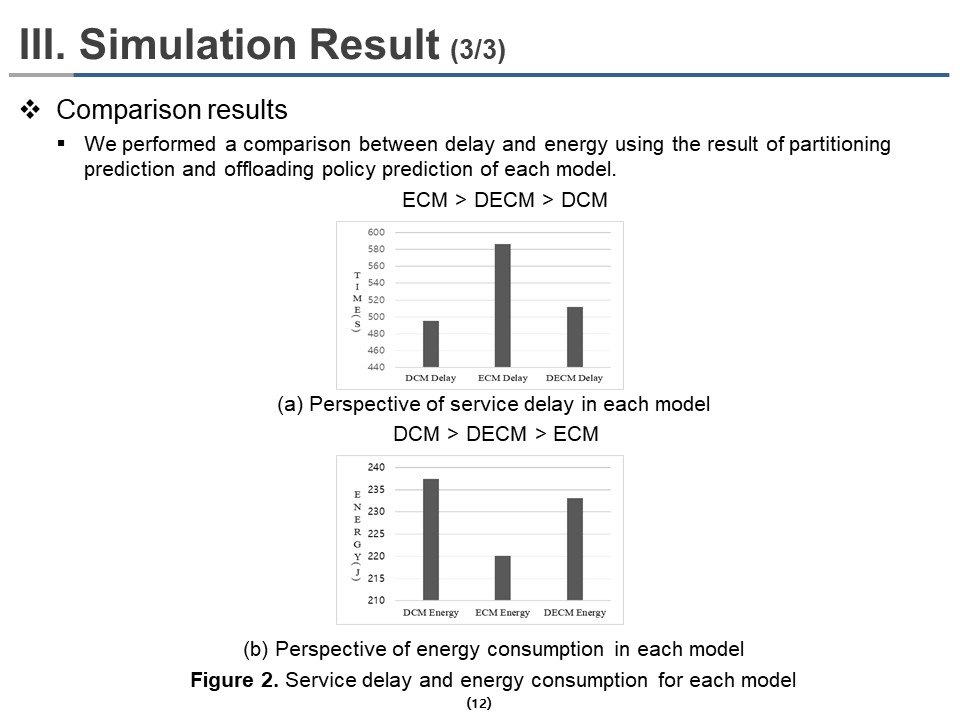
Figure 2 shows the results of the effect of delay and energy weighting on actual delay and energy by DCM model, ECM model, and DECM model, respectively. We performed a comparison between delay and energy using the result of partitioning prediction and offloading policy prediction of each model.
Figure 2(a) shows the comparison results from the perspective of delays in each model. As we adjusted the weight coefficient, the DCM model had the shortest delay, and the DECM model had the second short delay. The ECM model showed the most prolonged delay because the delay does not matter in the ECM model. Figure 2(b) shows the comparison results from the perspective of energies in each model. Similarly, the ECM model had the lowest energy consumption, followed by the DECM model with the second-lowest energy consumption, and the DCM model showed the highest energy consumption.
|
 IEEE/ICACT20220171 Slide.12
[Big Slide]
[YouTube]
IEEE/ICACT20220171 Slide.12
[Big Slide]
[YouTube]