 IEEE/ICACT20210244 Slide.16
[Big Slide]
Oral Presentation
IEEE/ICACT20210244 Slide.16
[Big Slide]
Oral Presentation 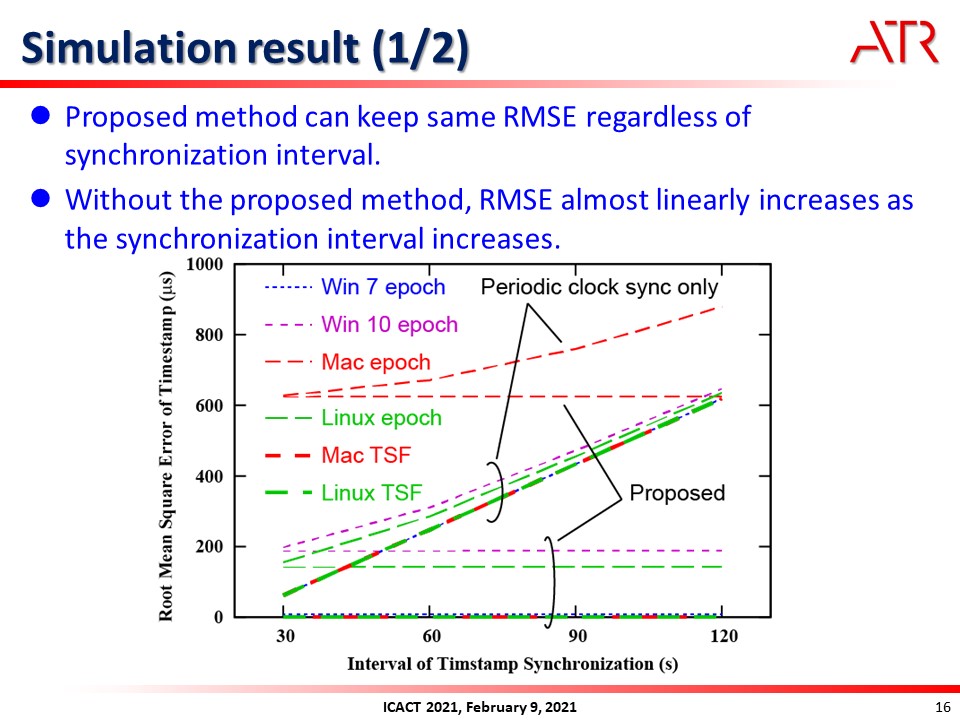
| Virual Oral Presentation Slide by Slide |
|
IEEE/ICACT20210244 Slide.16
[Big Slide]
| Oral Presentation |
|
|
|
This graph shows the RMSE performance of the timestamp compensation obtained by the simulation. The horizontal axis shows the interval of timestamp synchronization or compensation, and the vertical axis shows the RMSE of the timestamp after compensation. As shown in this graph, the proposed method can keep same RMSE regardless of synchronization interval. On the other hand, if the proposed method is not employed, the RMSE almost linearly increases as the synchronization interval increases. | |
| [Go to Next Slide] |