ICACT20250013 Slide.25
[Big slide for presentation] |
Chrome Text-to-Speach Click!! |
 |
Thank you for listening to my presentation. I'm now ready to take any questions you may have.
|
|
ICACT20250013 Slide.24
[Big slide for presentation]
|
Chrome Text-to-Speach Click!! |
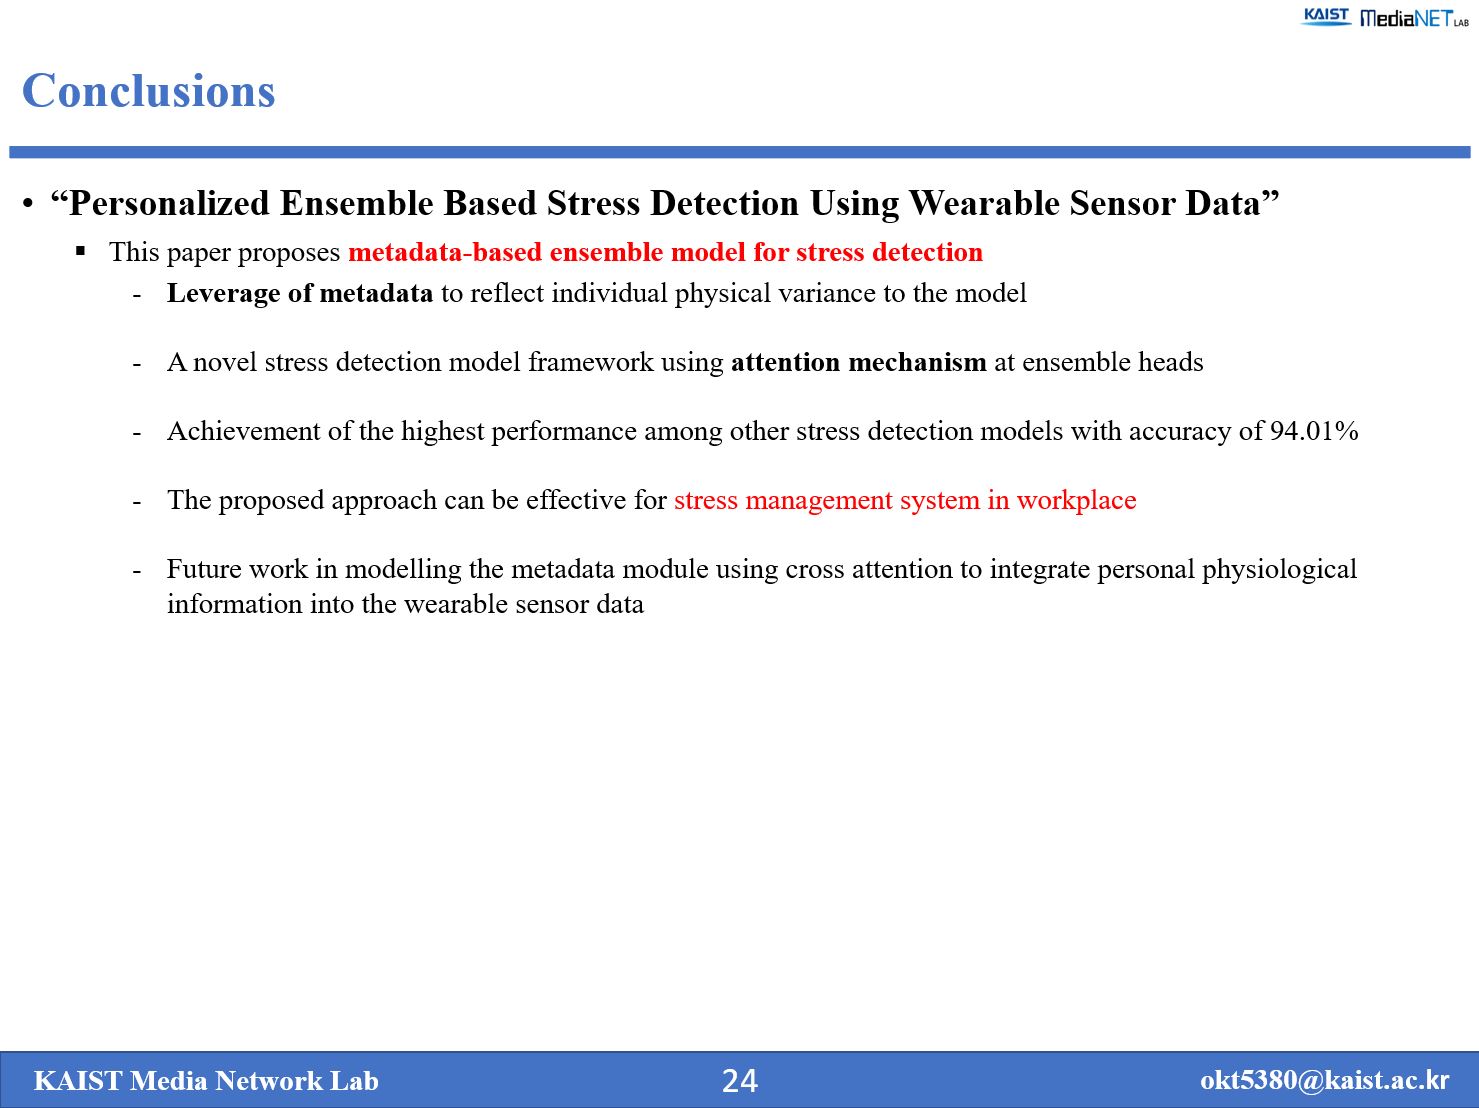 |
This paper introduces a metadata-based ensemble model for stress detection, leveraging metadata to capture individual variations. We employ an attention mechanism across multiple ensemble heads for more accurate stress detection. Consequently, our approach achieves the highest performance among various methods, making it well-suited for workplace stress management services.
|
|
ICACT20250013 Slide.23
[Big slide for presentation]
|
Chrome Text-to-Speach Click!! |
 |
Until now, we’ve presented our model design and discussed the corresponding experimental results.
|
|
ICACT20250013 Slide.22
[Big slide for presentation]
|
Chrome Text-to-Speach Click!! |
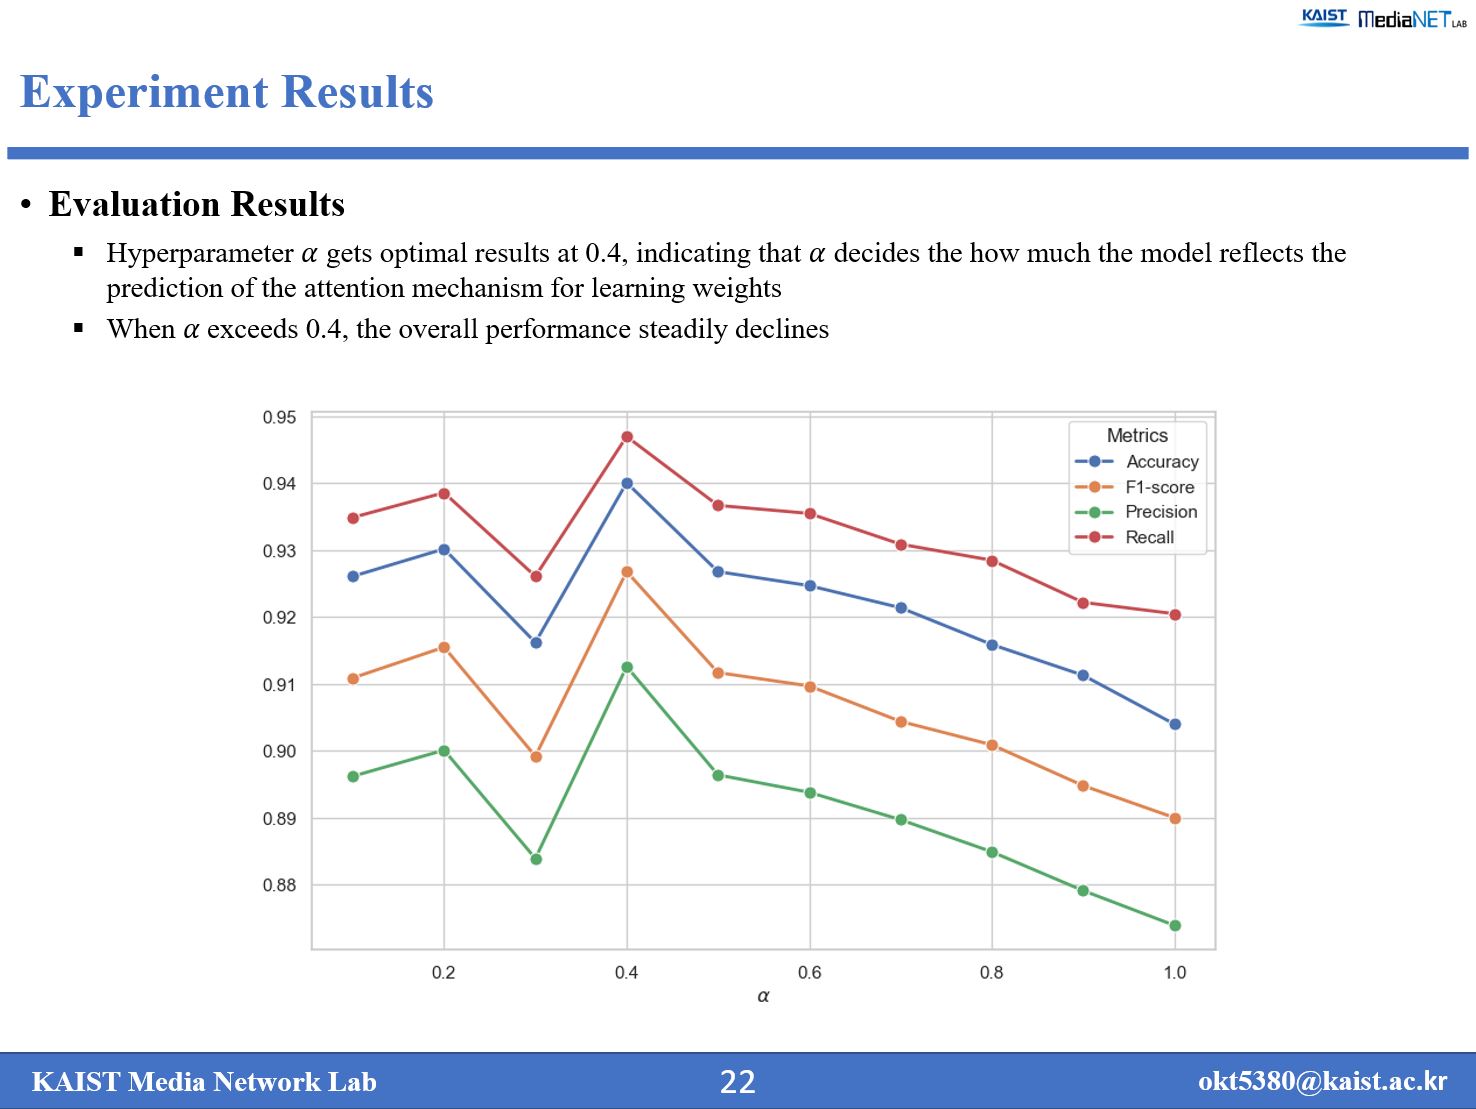 |
We conducted a study on alpha, the hyperparameter that determines how much the attention mechanism’s predictions influence the final output. Our findings show that alpha value of 0.4 yields the best performance. When the value exceeds 0.4, the overall performance steadily declines.
|
|
ICACT20250013 Slide.21
[Big slide for presentation]
|
Chrome Text-to-Speach Click!! |
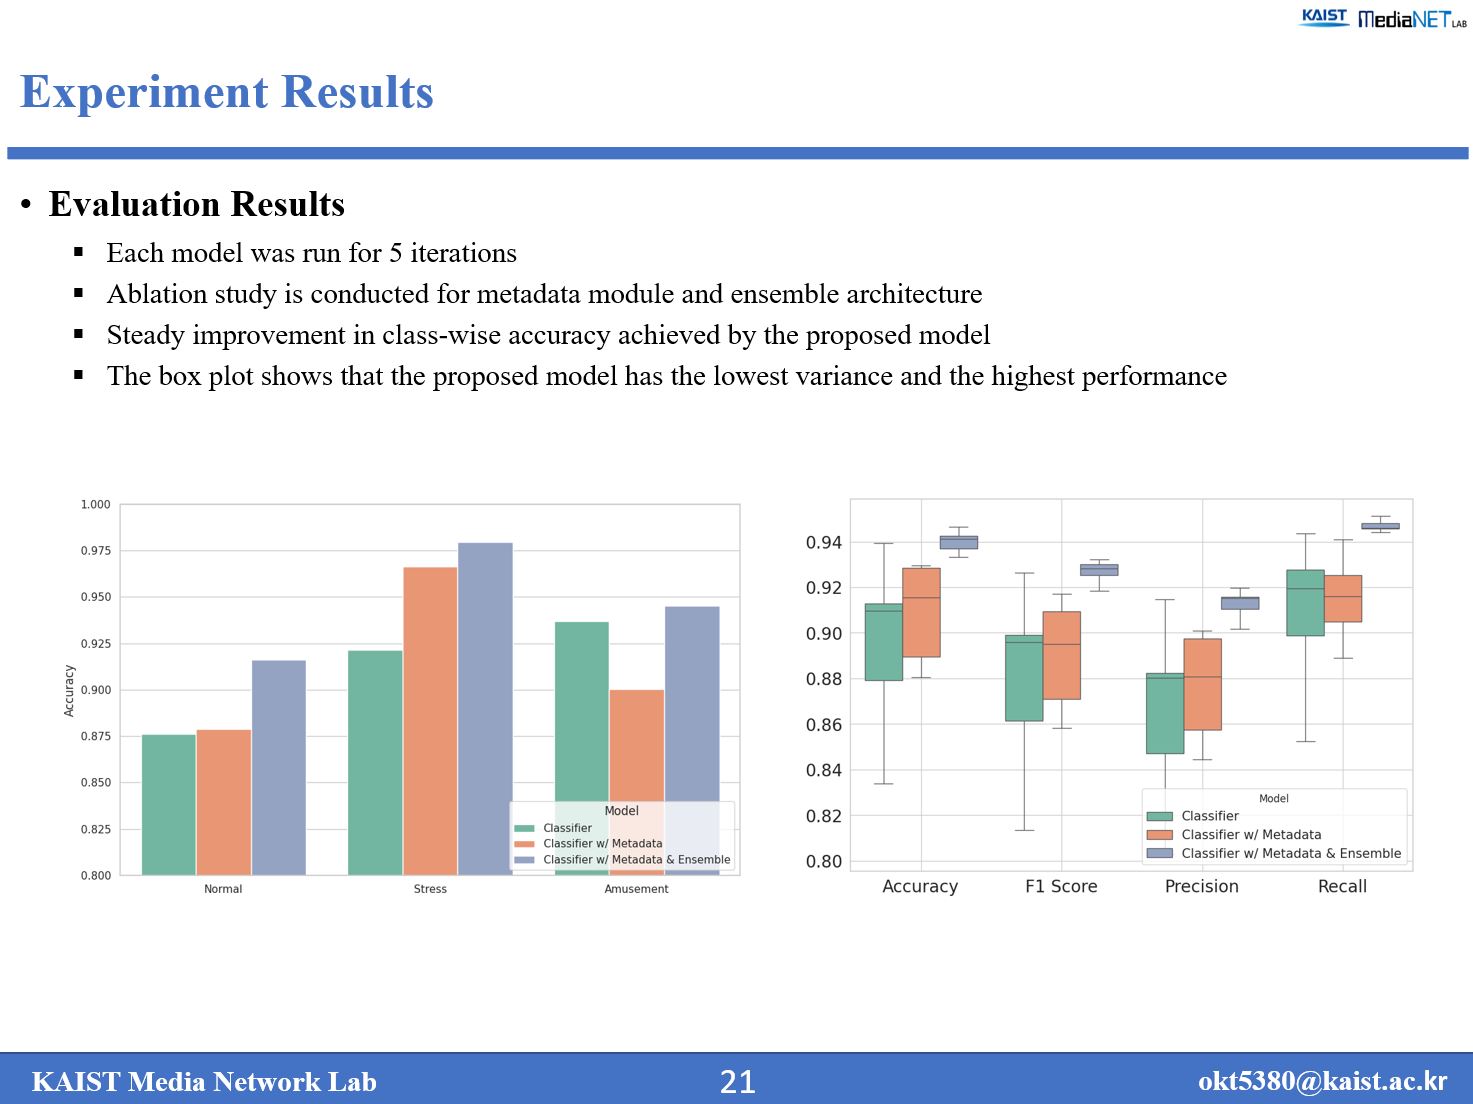 |
These figures present the results of our ablation study. The plot on the left illustrates a steady improvement in class-wise accuracy achieved by the proposed model. Meanwhile, the box plot on the right indicates that our model has both the lowest variance and the highest performance. This underscores the effectiveness of incorporating metadata and an ensemble architecture in addressing personal variance.
|
|
ICACT20250013 Slide.20
[Big slide for presentation]
|
Chrome Text-to-Speach Click!! |
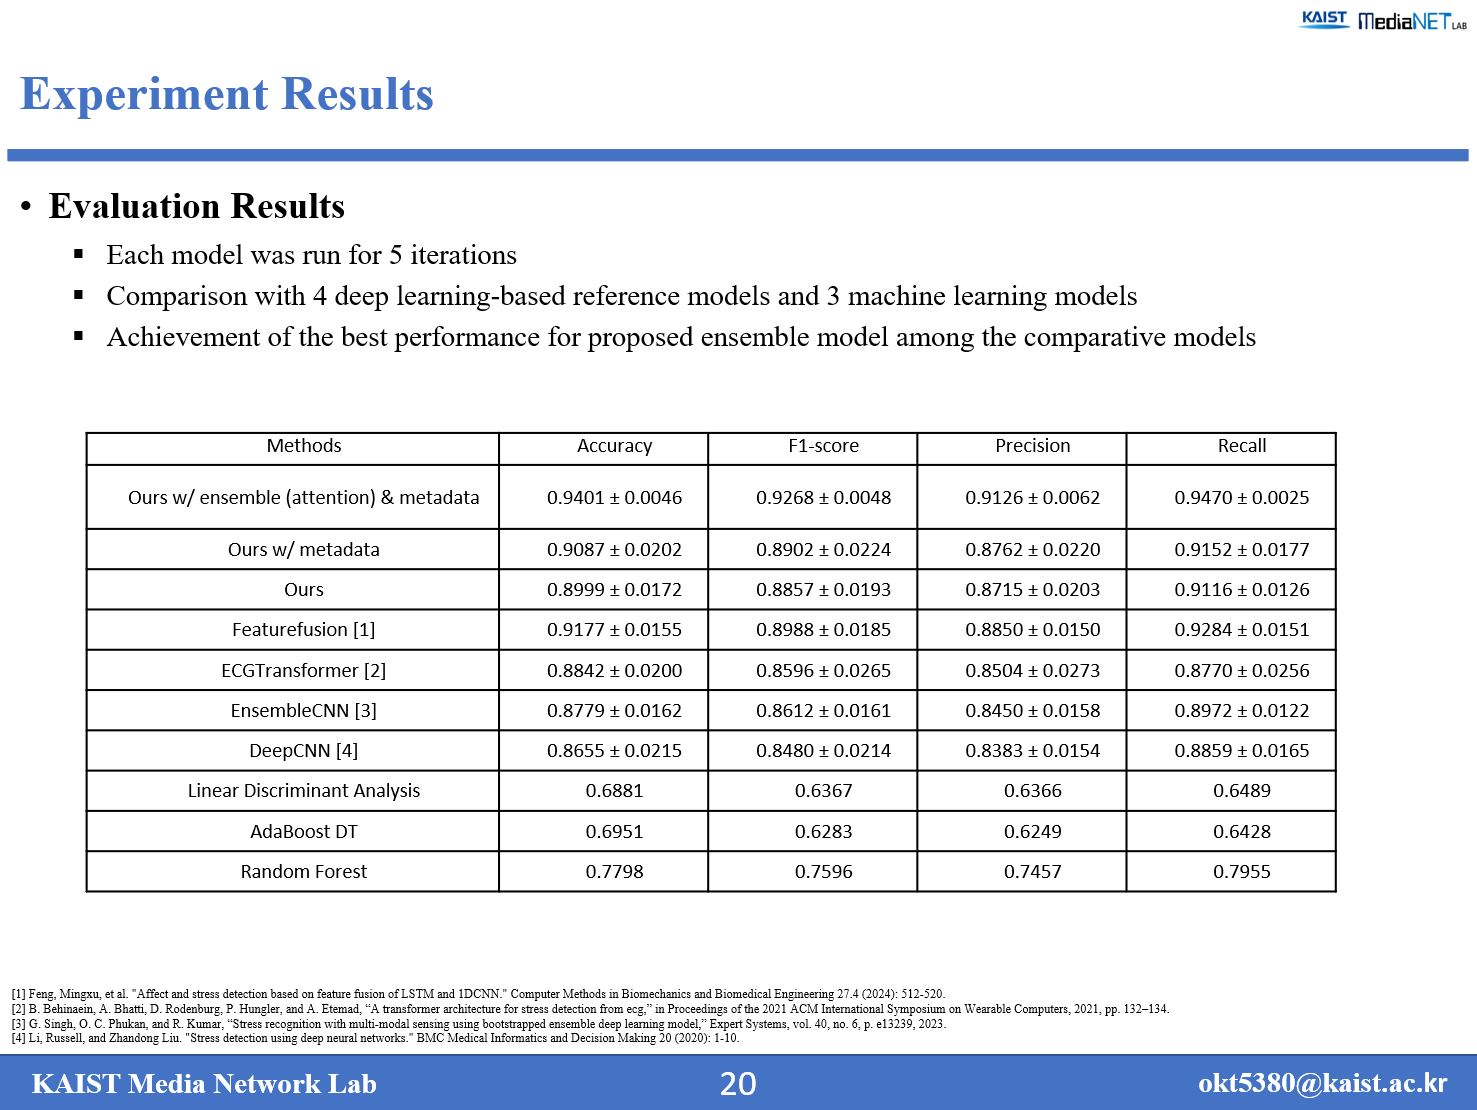 |
The following table shows the experimental results, averaged over five rounds of evaluation. We compare our proposed model against various deep-learning and machine-learning methods. Notably, the proposed model achieves both the lowest variance and the highest performance across all metrics, indicating that it effectively reduces inference variance.
|
|
ICACT20250013 Slide.19
[Big slide for presentation]
|
Chrome Text-to-Speach Click!! |
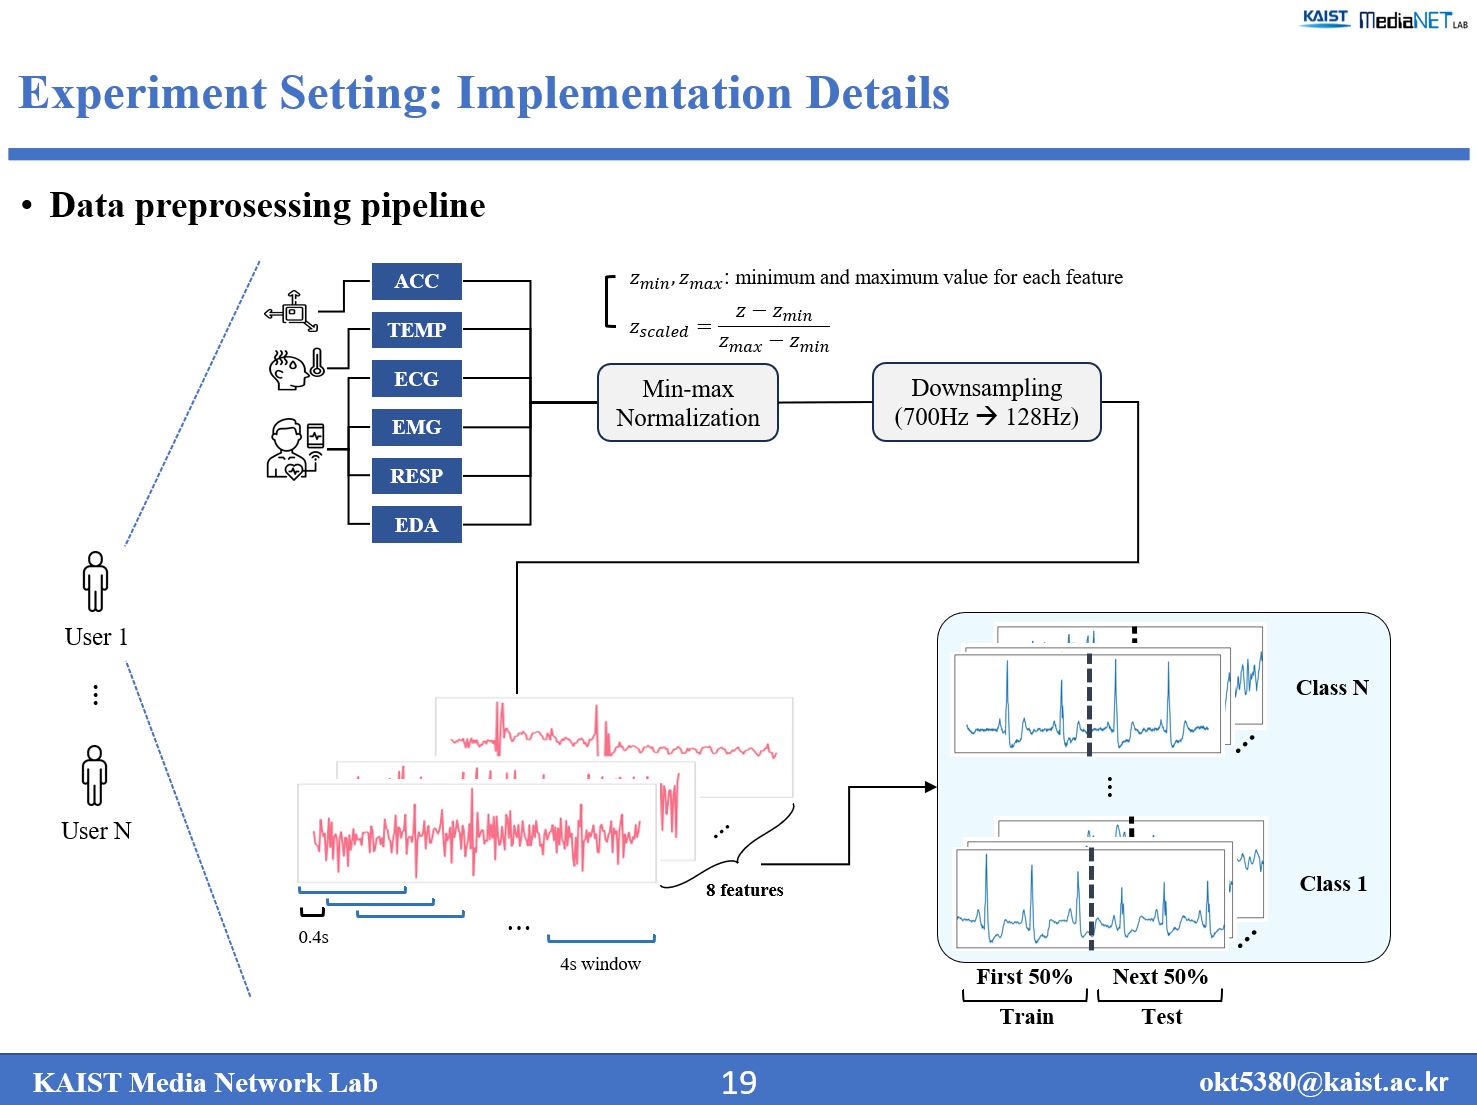 |
Preprocessing for the raw sensor data follows the procedure described in this slide. We split the data for each class using a 50:50 train-test ratio
|
|
ICACT20250013 Slide.18
[Big slide for presentation]
|
Chrome Text-to-Speach Click!! |
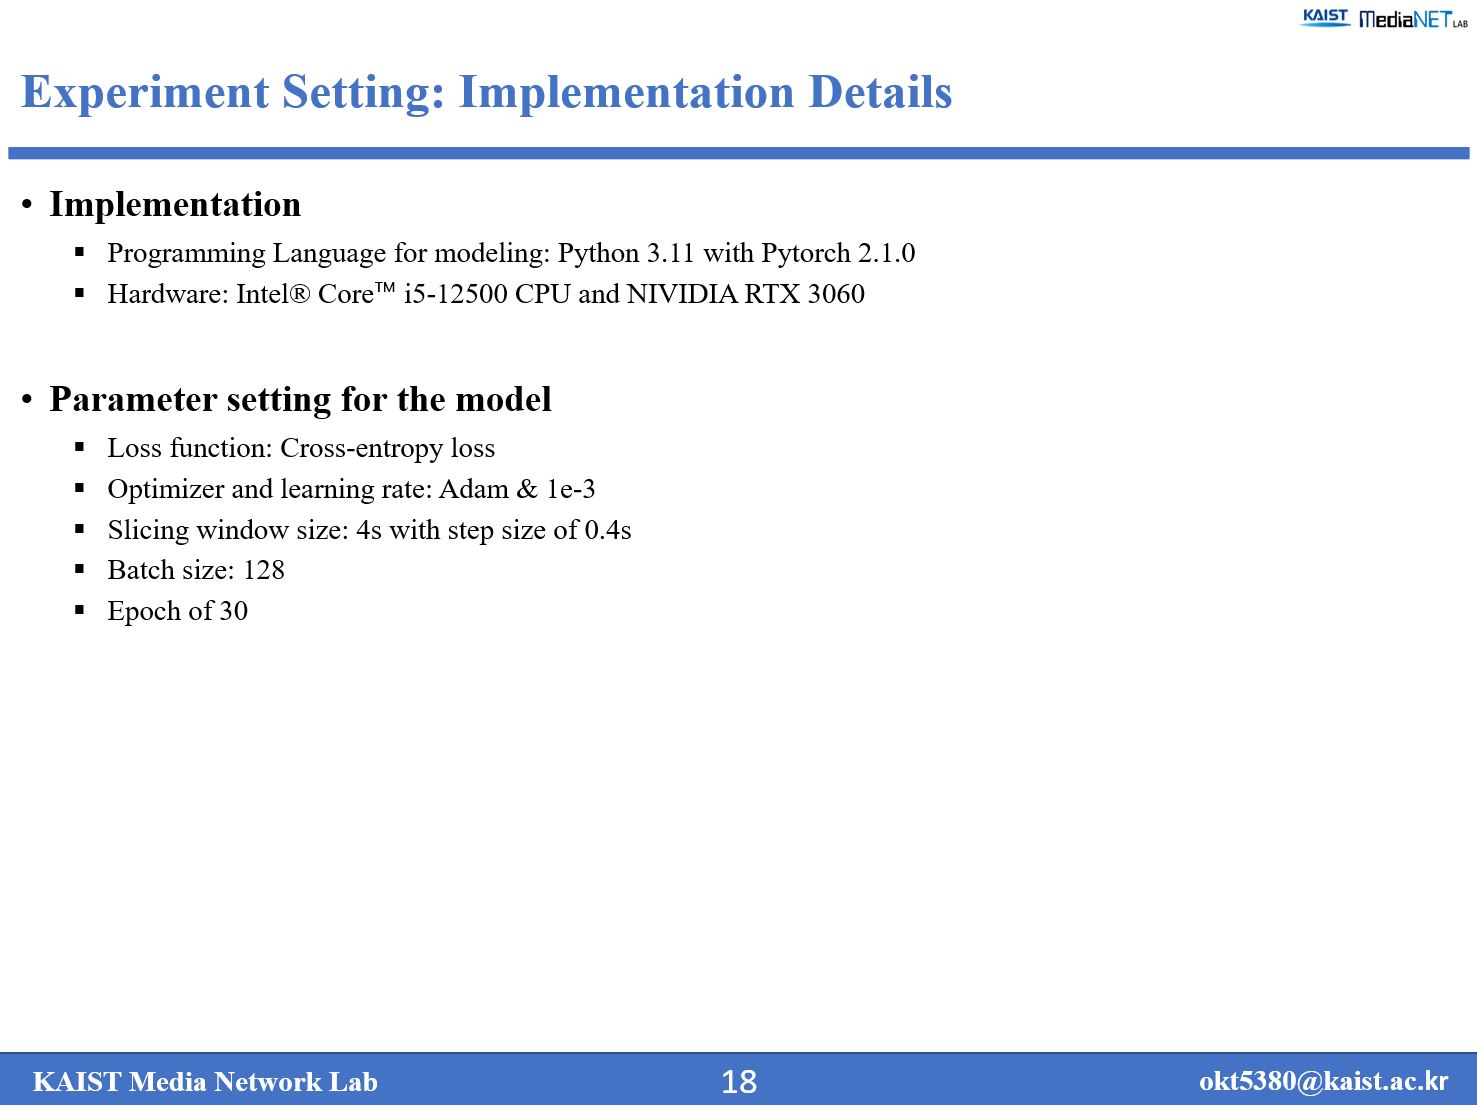 |
Here are our specific experiment settings: we used a 4-second window size with a 0.4-second step size, a batch size of 128, and we trained the model for 30 epochs.
|
|
ICACT20250013 Slide.17
[Big slide for presentation]
|
Chrome Text-to-Speach Click!! |
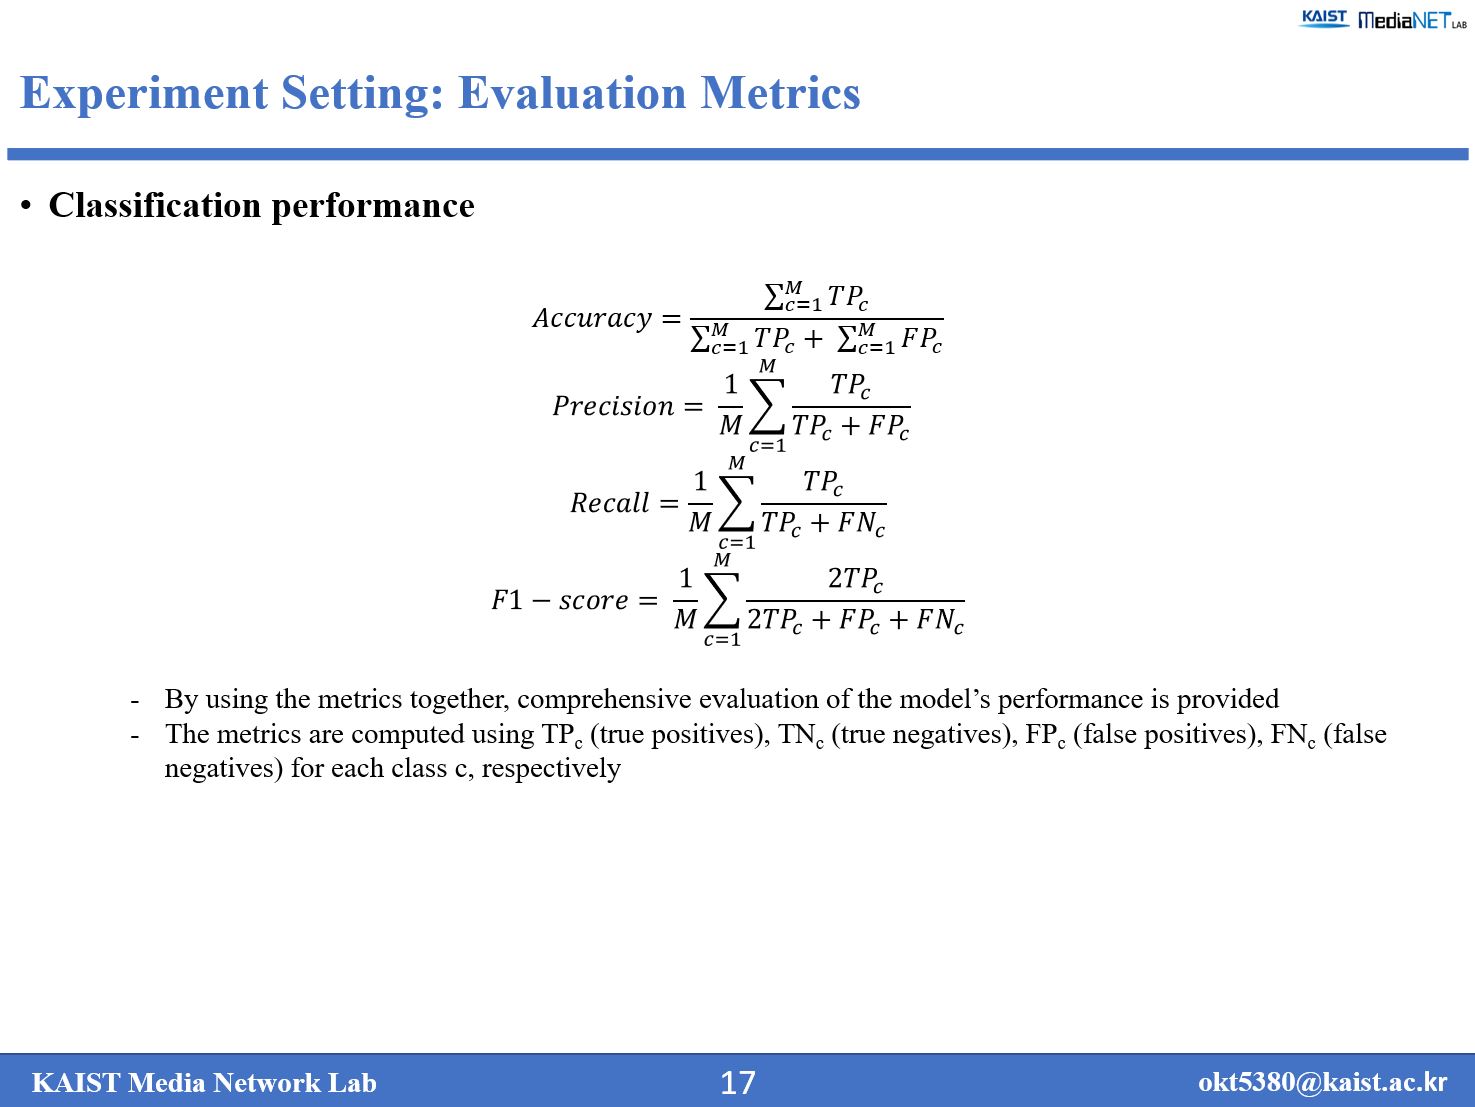 |
The performance of the model is evaluated using common metrics of accuracy, F1-score, precision, and recall. By using the metrics together, comprehensive evaluation of the model’s performance is provided. The metrics are computed using TPc (true positives), TNc (true negatives), FPc (false positives), FNc (false negatives) for each class c, respectively.
|
|
ICACT20250013 Slide.16
[Big slide for presentation]
|
Chrome Text-to-Speach Click!! |
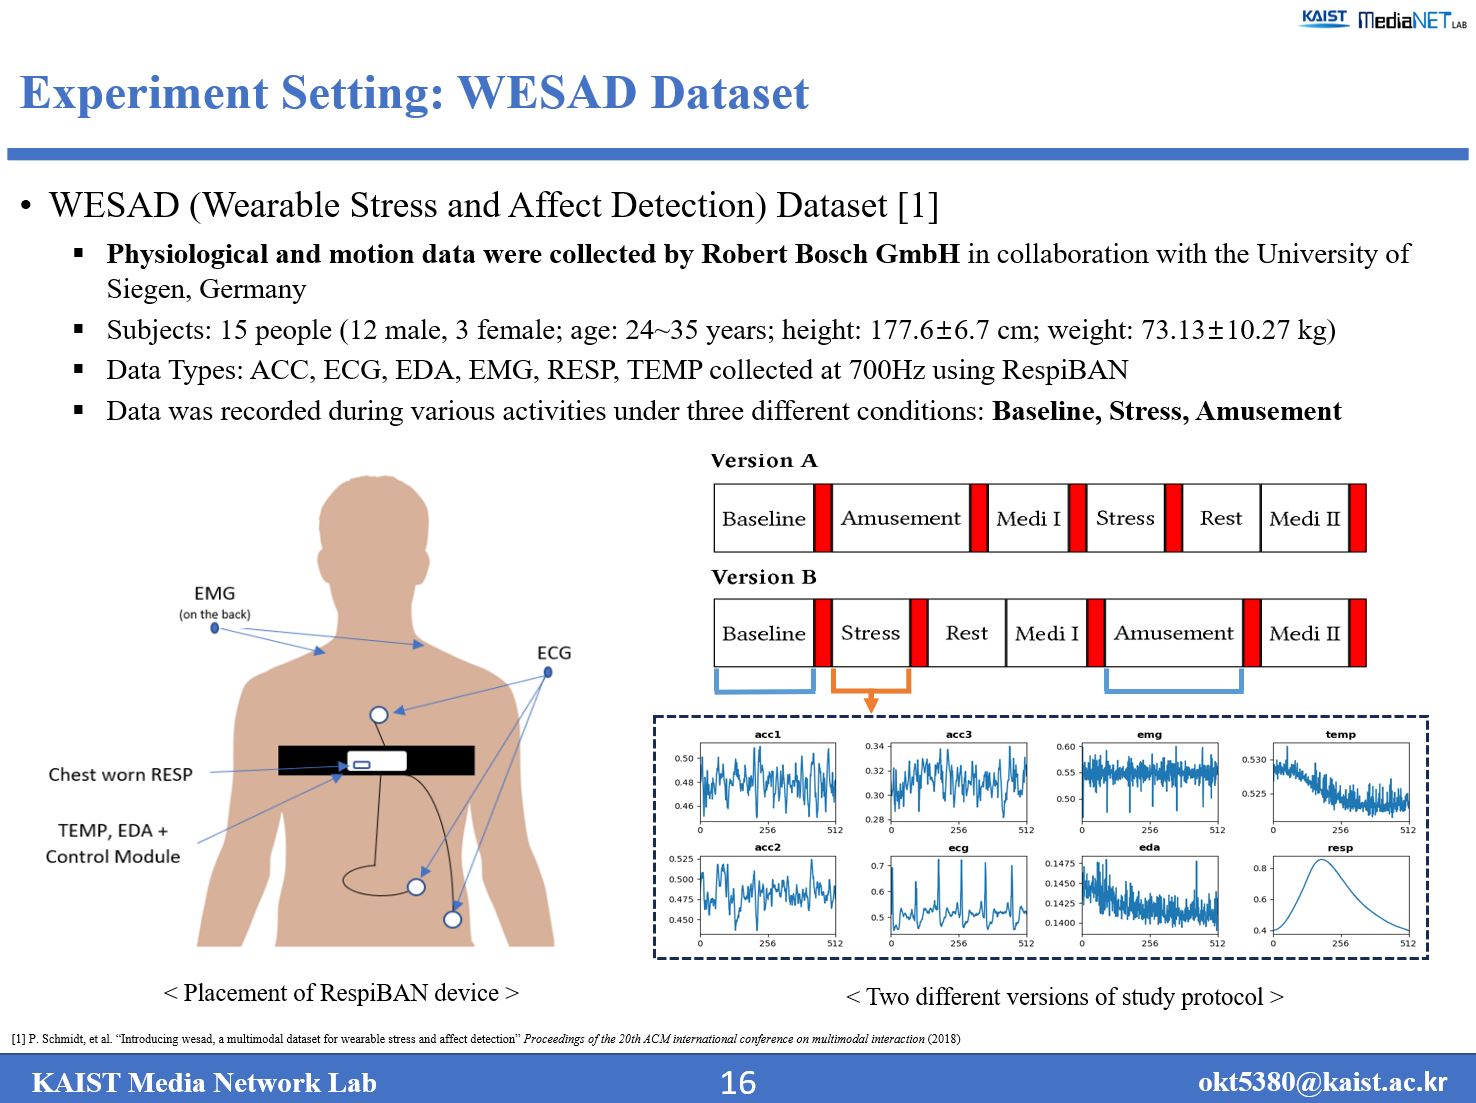 |
WESAD is a wearable stress detection dataset developed through a collaboration between Robert Bosch and the University of Siegen in Germany. It contains both physiological and motion signals, as shown here. Fifteen participants took part in the experiments, and the dataset also includes specific metadata for each participant, such as age, gender, height, and weight.
|
|
ICACT20250013 Slide.15
[Big slide for presentation]
|
Chrome Text-to-Speach Click!! |
 |
Experiment setting and results will be provided in this section.
|
|
ICACT20250013 Slide.14
[Big slide for presentation]
|
Chrome Text-to-Speach Click!! |
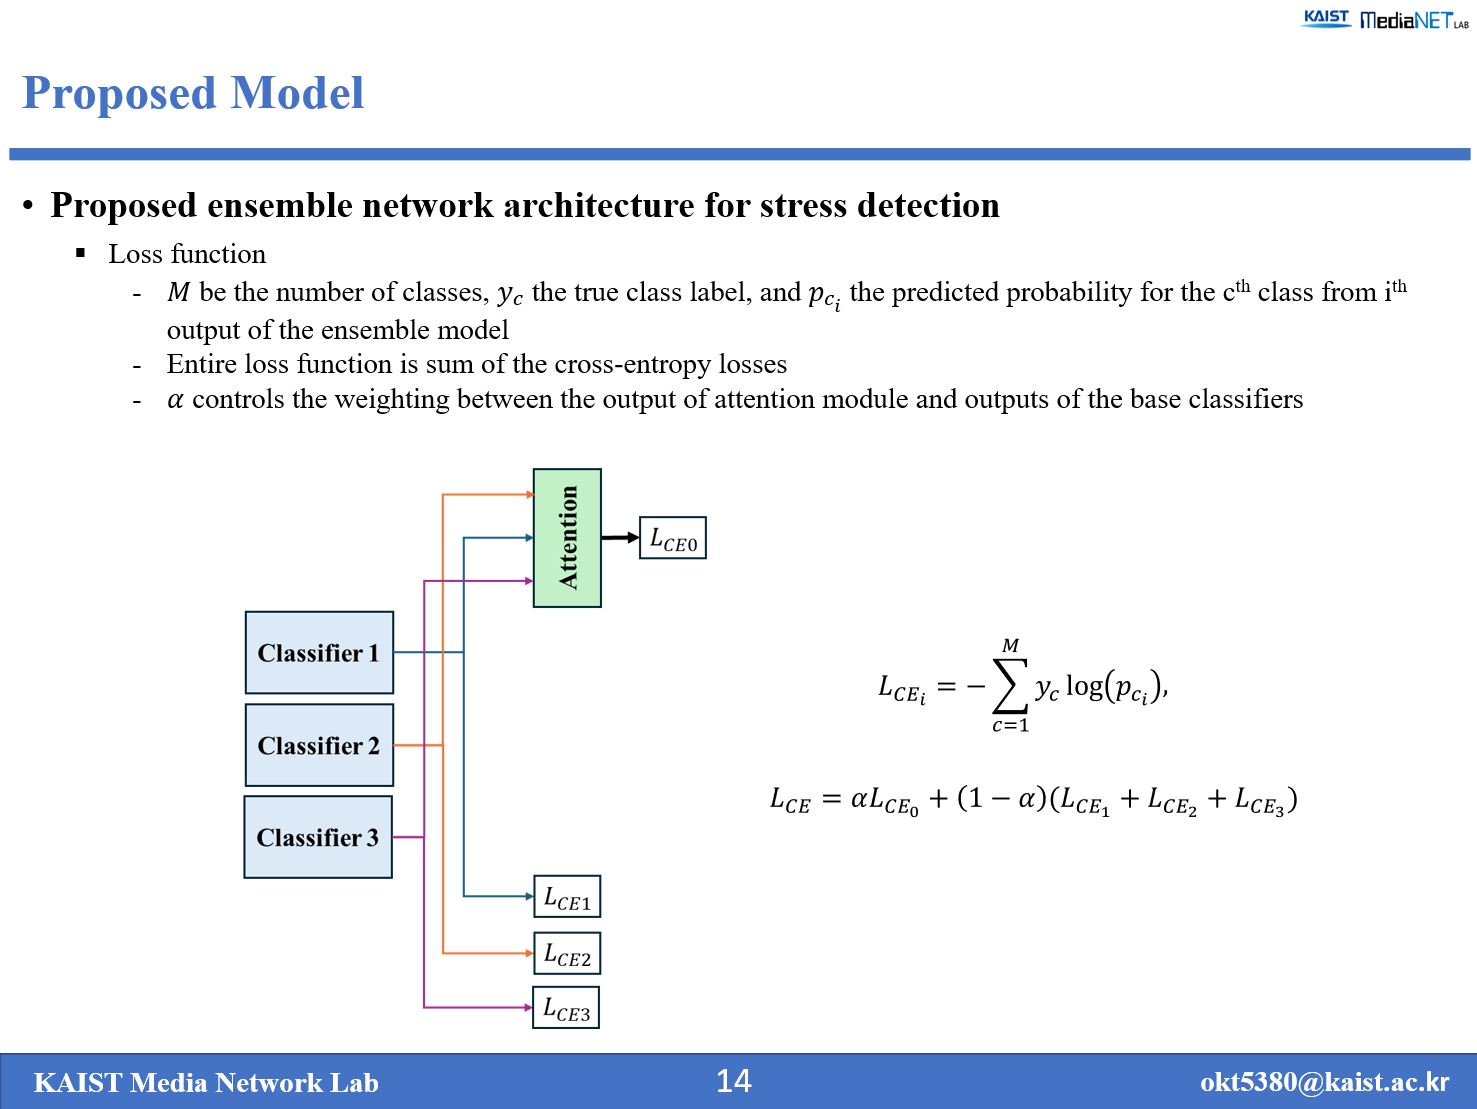 |
The overall loss function is the sum of cross-entropy losses from both the submodels and the attention module. Each output undergoes a cross-entropy calculation. The parameter alpha controls the weighting between the attention module’s output and the base classifiers’ outputs.
|
|
ICACT20250013 Slide.13
[Big slide for presentation]
|
Chrome Text-to-Speach Click!! |
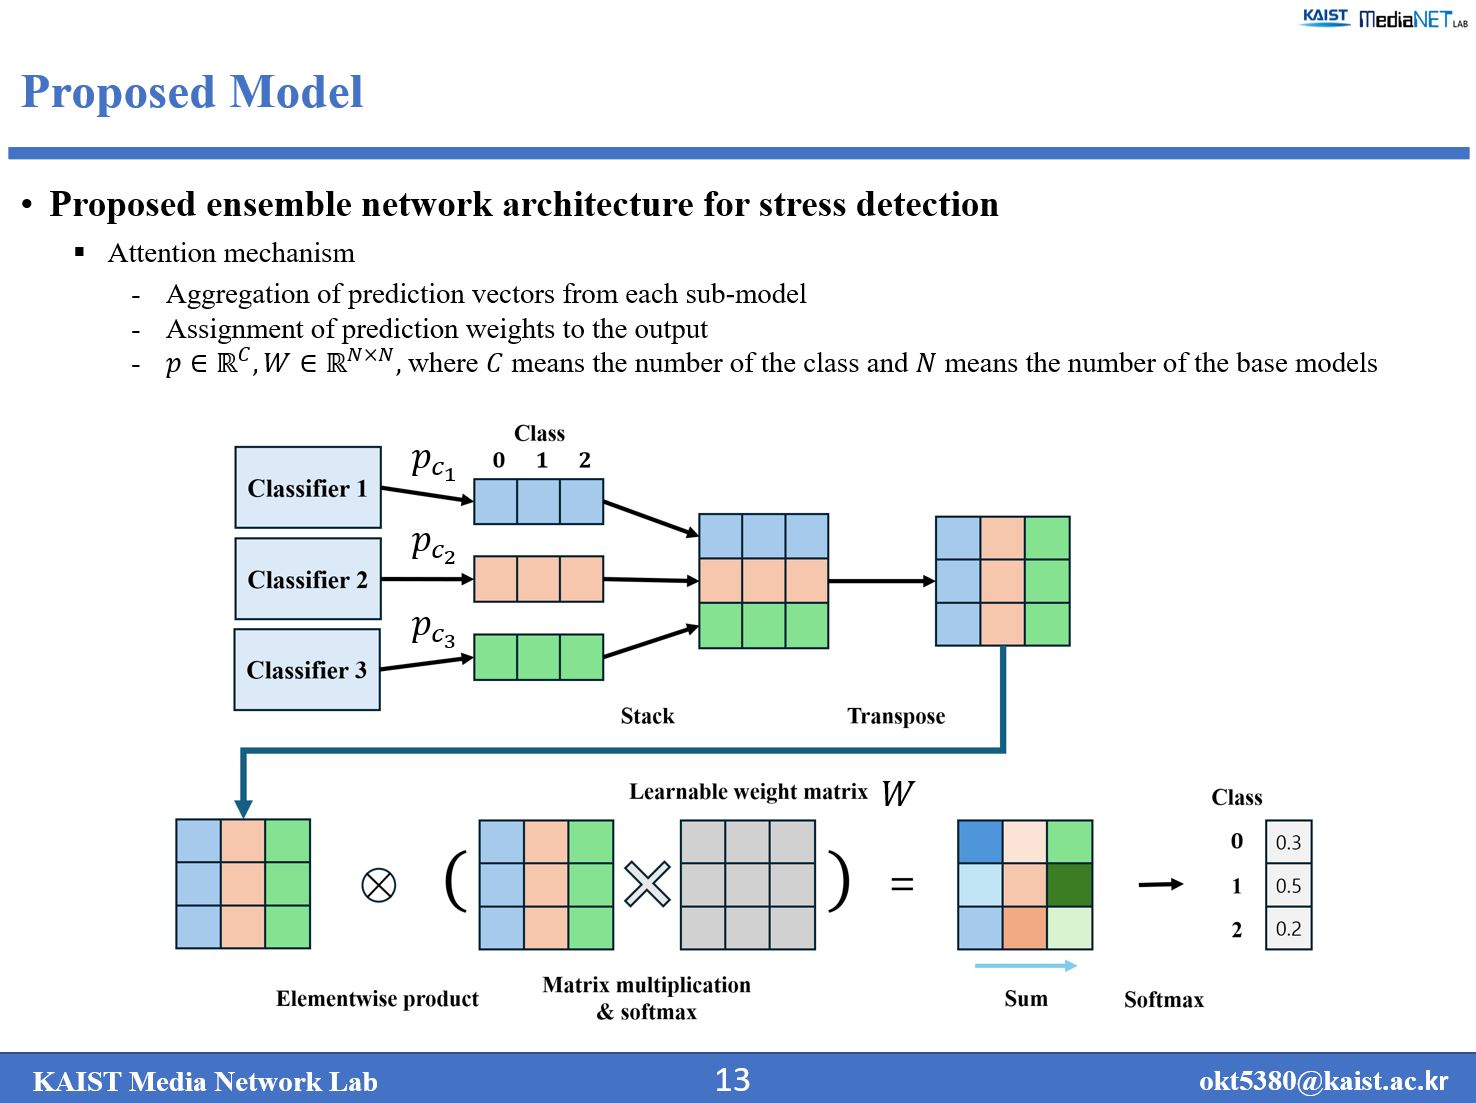 |
The attention module stacks all sub-results, transposes them, and multiplies them by a learnable weight matrix. It then sums these values over the dimension corresponding to the number of submodels.
|
|
ICACT20250013 Slide.12
[Big slide for presentation]
|
Chrome Text-to-Speach Click!! |
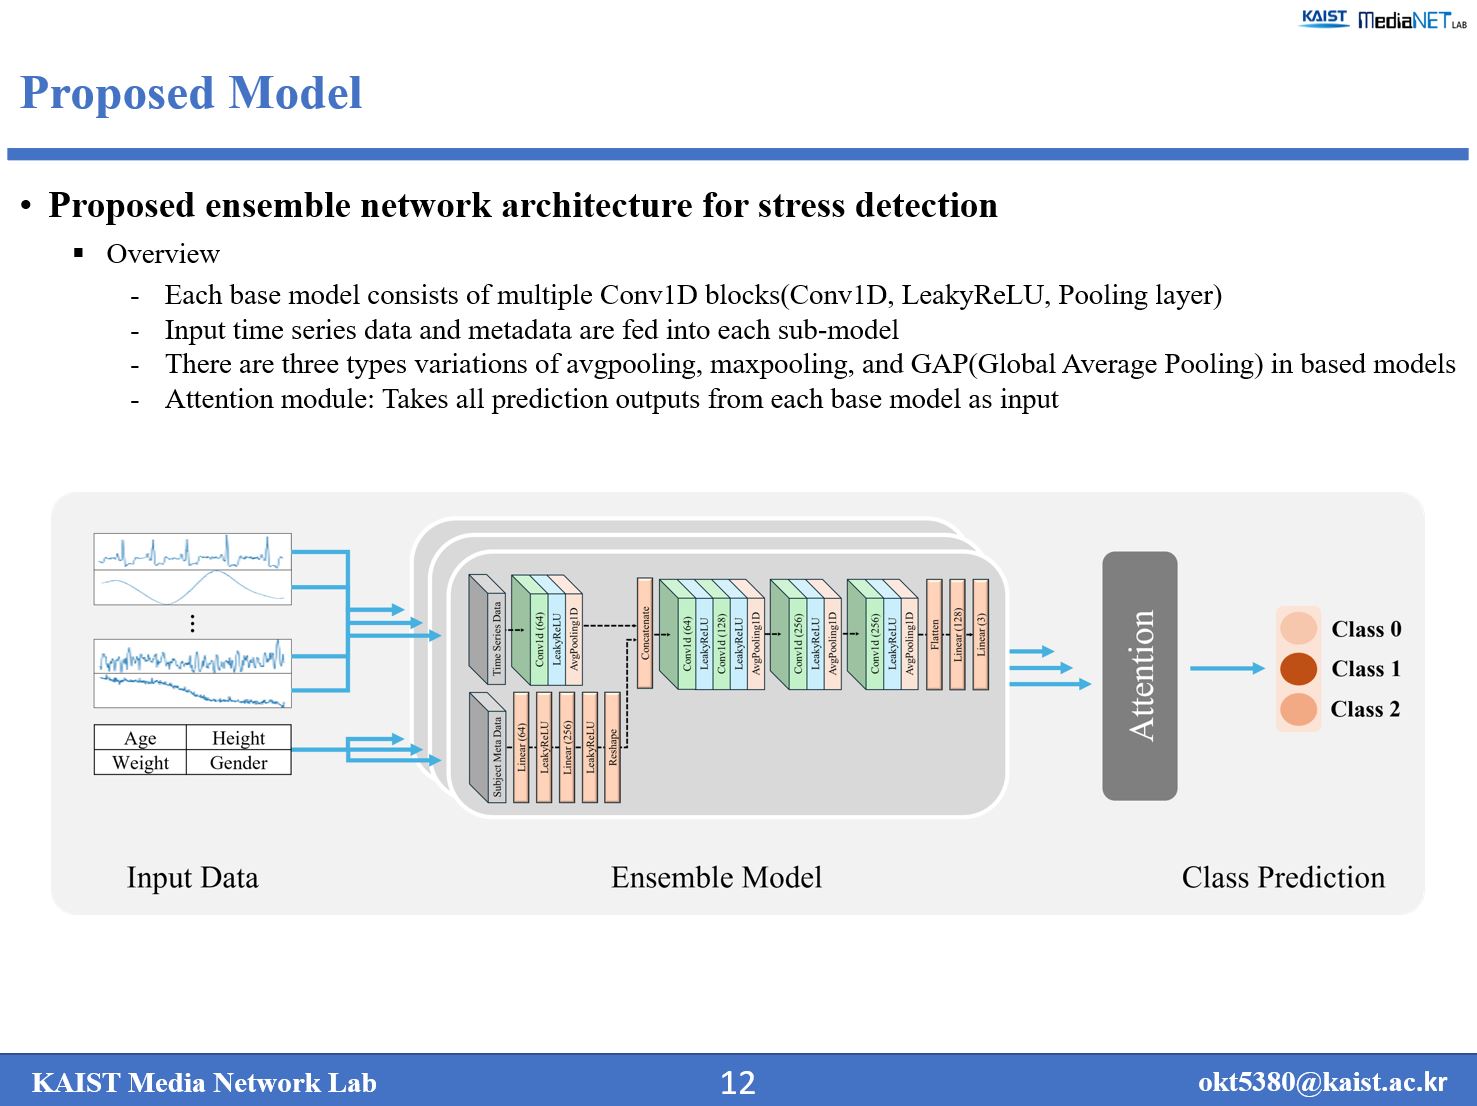 |
Here we have our proposed ensemble network architecture. Each base model is composed of multiple Conv1D blocks, and time-series data along with metadata are fed into each sub-model. We used three types of pooling layers: average pooling, max pooling, and global average pooling (GAP). Finally, the prediction values from each sub-model are passed to an attention layer that generates the final prediction.
|
|
ICACT20250013 Slide.11
[Big slide for presentation]
|
Chrome Text-to-Speach Click!! |
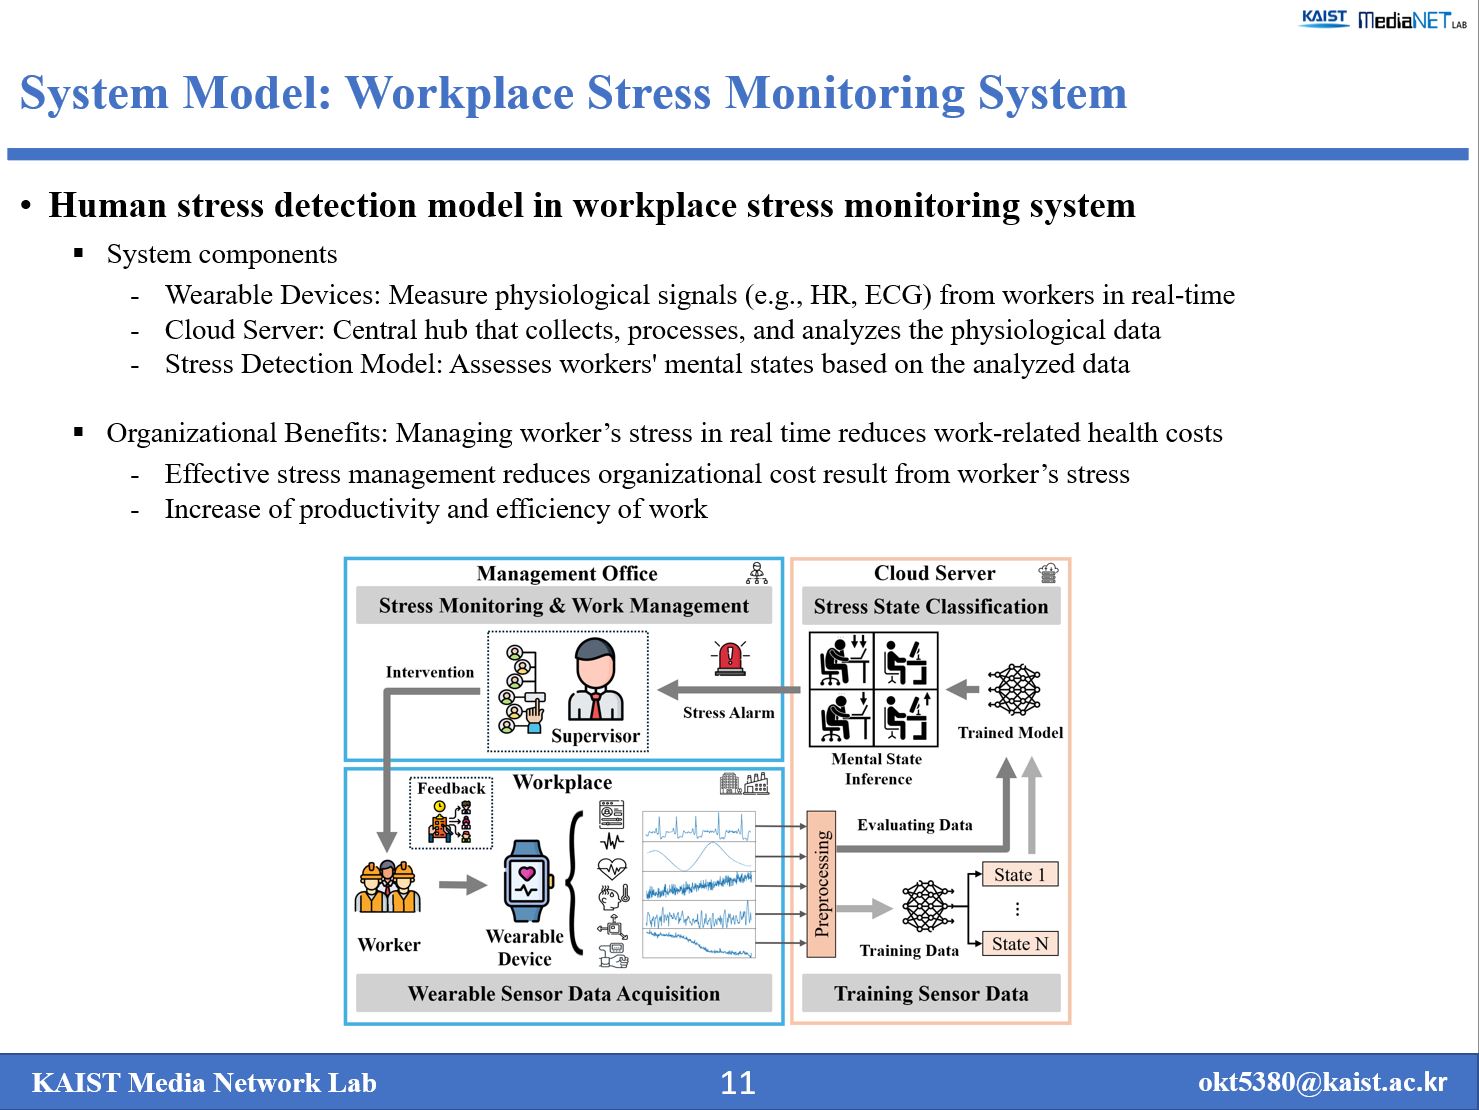 |
This kind of system offers organizations several benefits. It helps reduce work-related health expenses and other stress-related costs, while simultaneously increasing productivity and efficiency.
|
|
ICACT20250013 Slide.10
[Big slide for presentation]
|
Chrome Text-to-Speach Click!! |
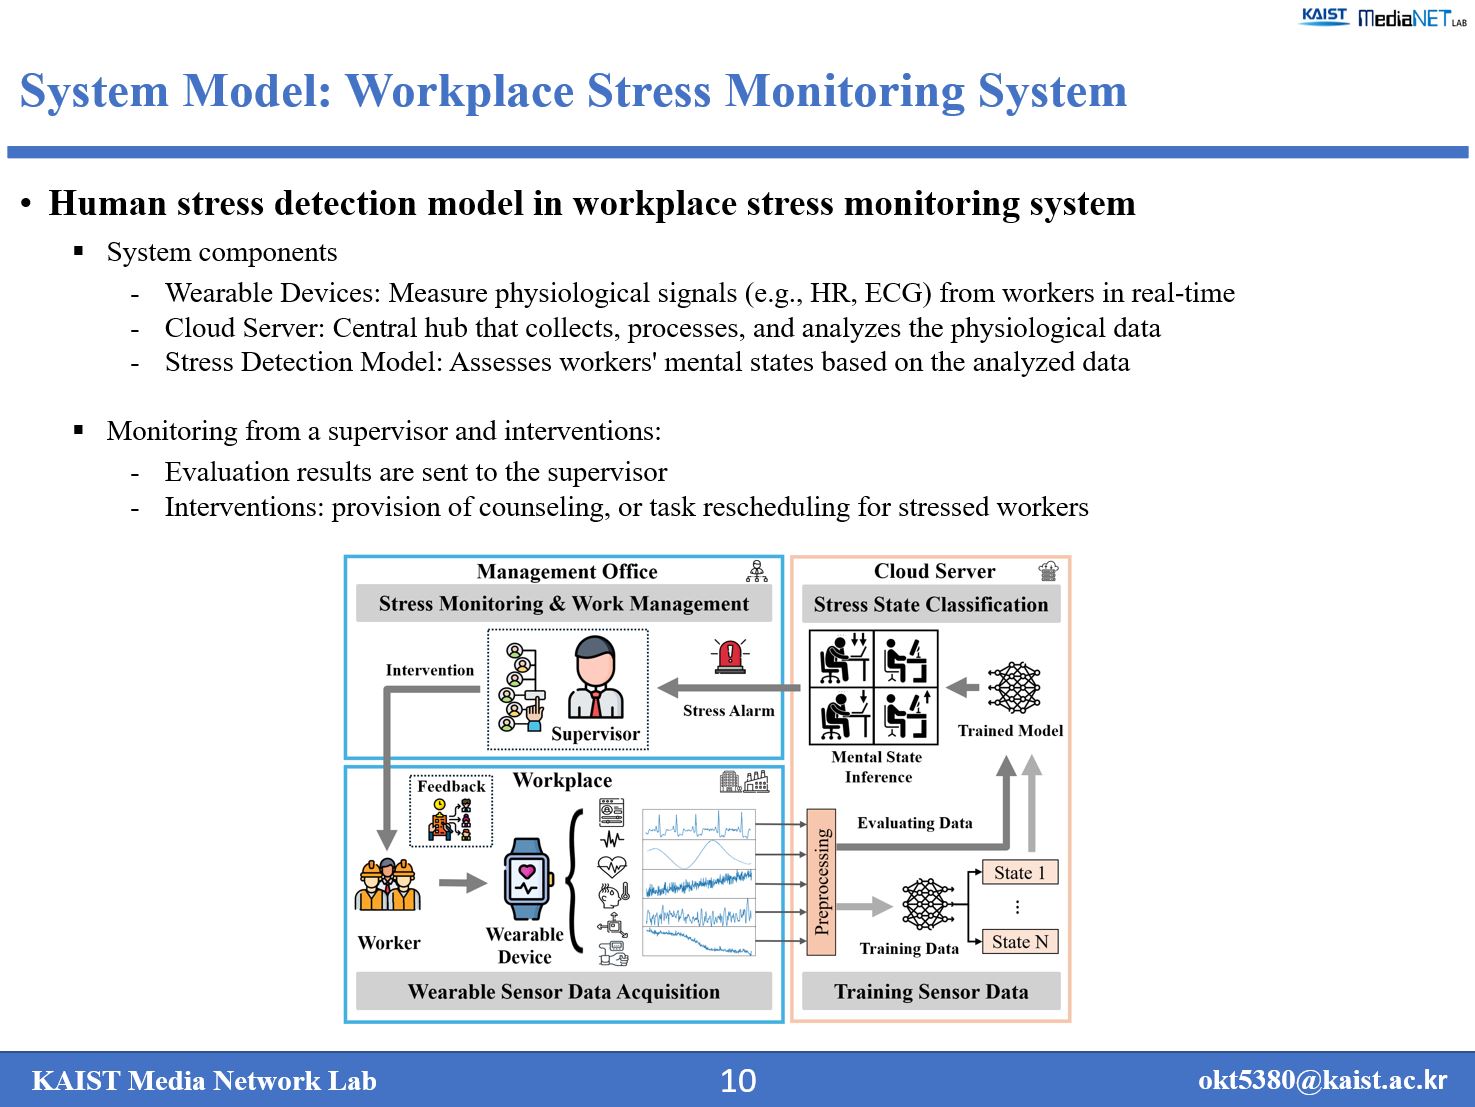 |
Now, I’ll describe the human stress detection model used in our workplace stress monitoring system. The system is composed of wearable devices that capture physiological signals from workers in real time, as well as a cloud server that collects, processes, and analyzes these signals. Based on the analyzed data, the stress detection model evaluates each worker’s mental state. The results are then shared with a supervisor, who can intervene by offering counseling or adjusting task schedules as necessary.
|
|
ICACT20250013 Slide.09
[Big slide for presentation]
|
Chrome Text-to-Speach Click!! |
 |
A detailed explanation of the main chapter will follow.
|
|
ICACT20250013 Slide.08
[Big slide for presentation]
|
Chrome Text-to-Speach Click!! |
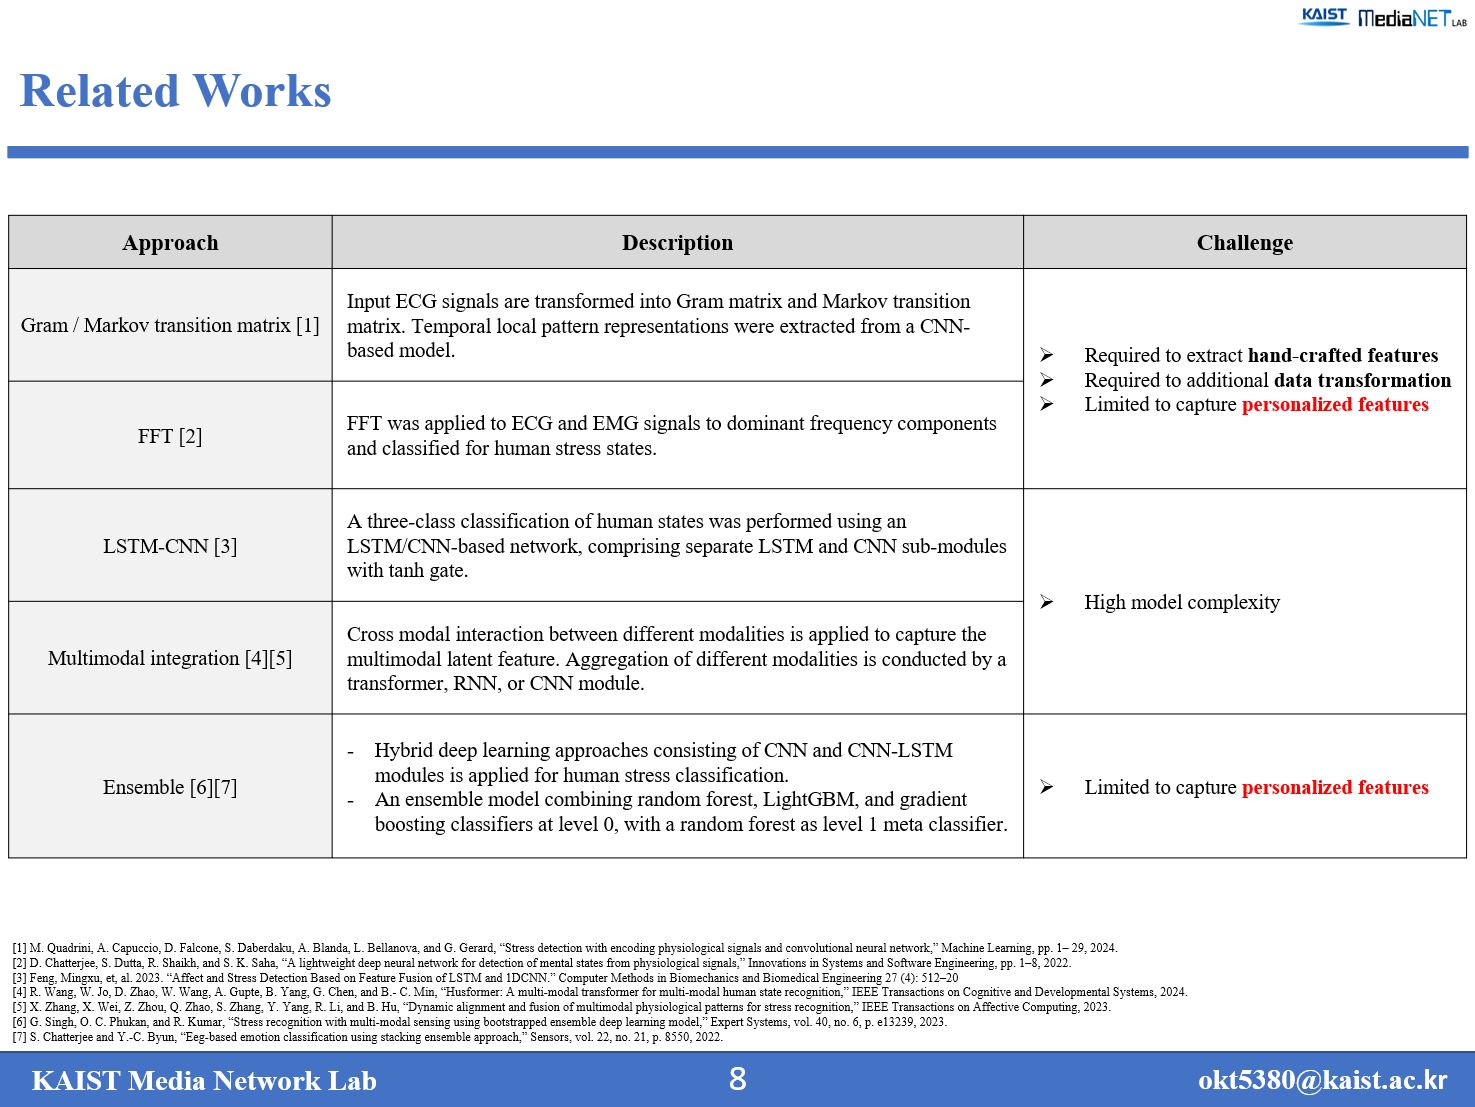 |
Many approaches have been proposed to detect human mental states. However, Some methods rely on handcrafted feature extraction that requires specialized domain knowledge. Moreover, both traditional machine learning and deep learning methods often fail to account for individual differences.
|
|
ICACT20250013 Slide.07
[Big slide for presentation]
|
Chrome Text-to-Speach Click!! |
 |
Let me briefly introduce the related works before moving on to the main chapter.
|
|
ICACT20250013 Slide.06
[Big slide for presentation]
|
Chrome Text-to-Speach Click!! |
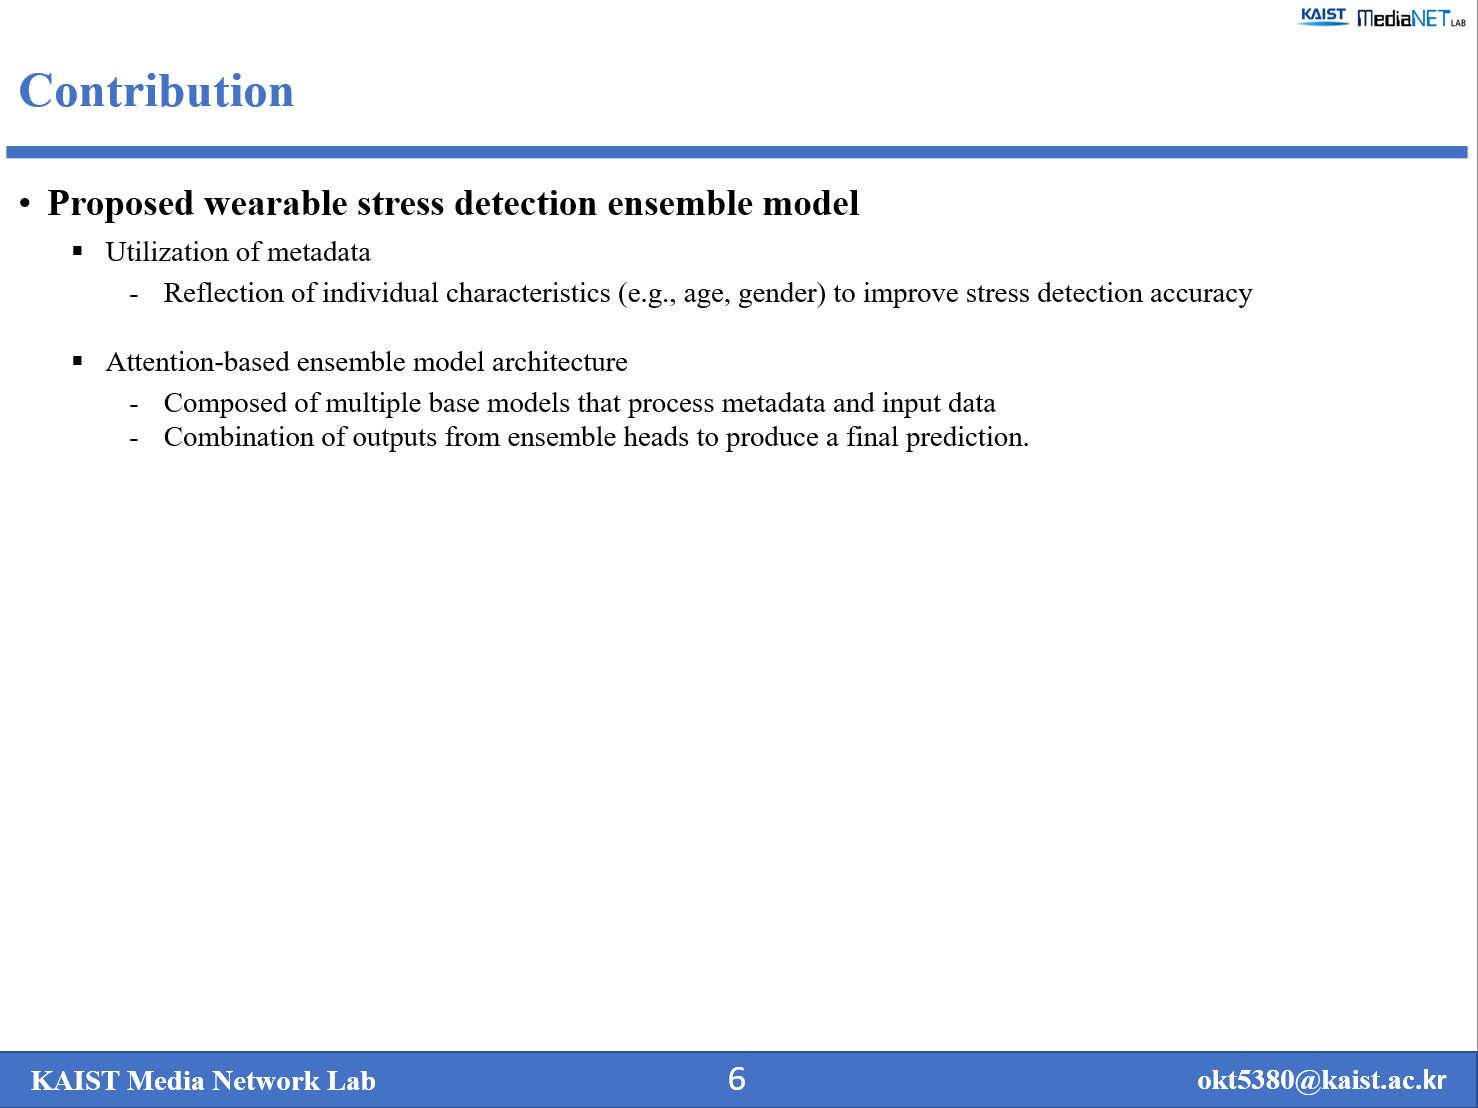 |
The proposed wearable stress detection ensemble model offers these key contributions: by accounting for individual variances and incorporating an attention-based ensemble architecture, the model significantly enhances stress detection accuracy.
|
|
ICACT20250013 Slide.05
[Big slide for presentation]
|
Chrome Text-to-Speach Click!! |
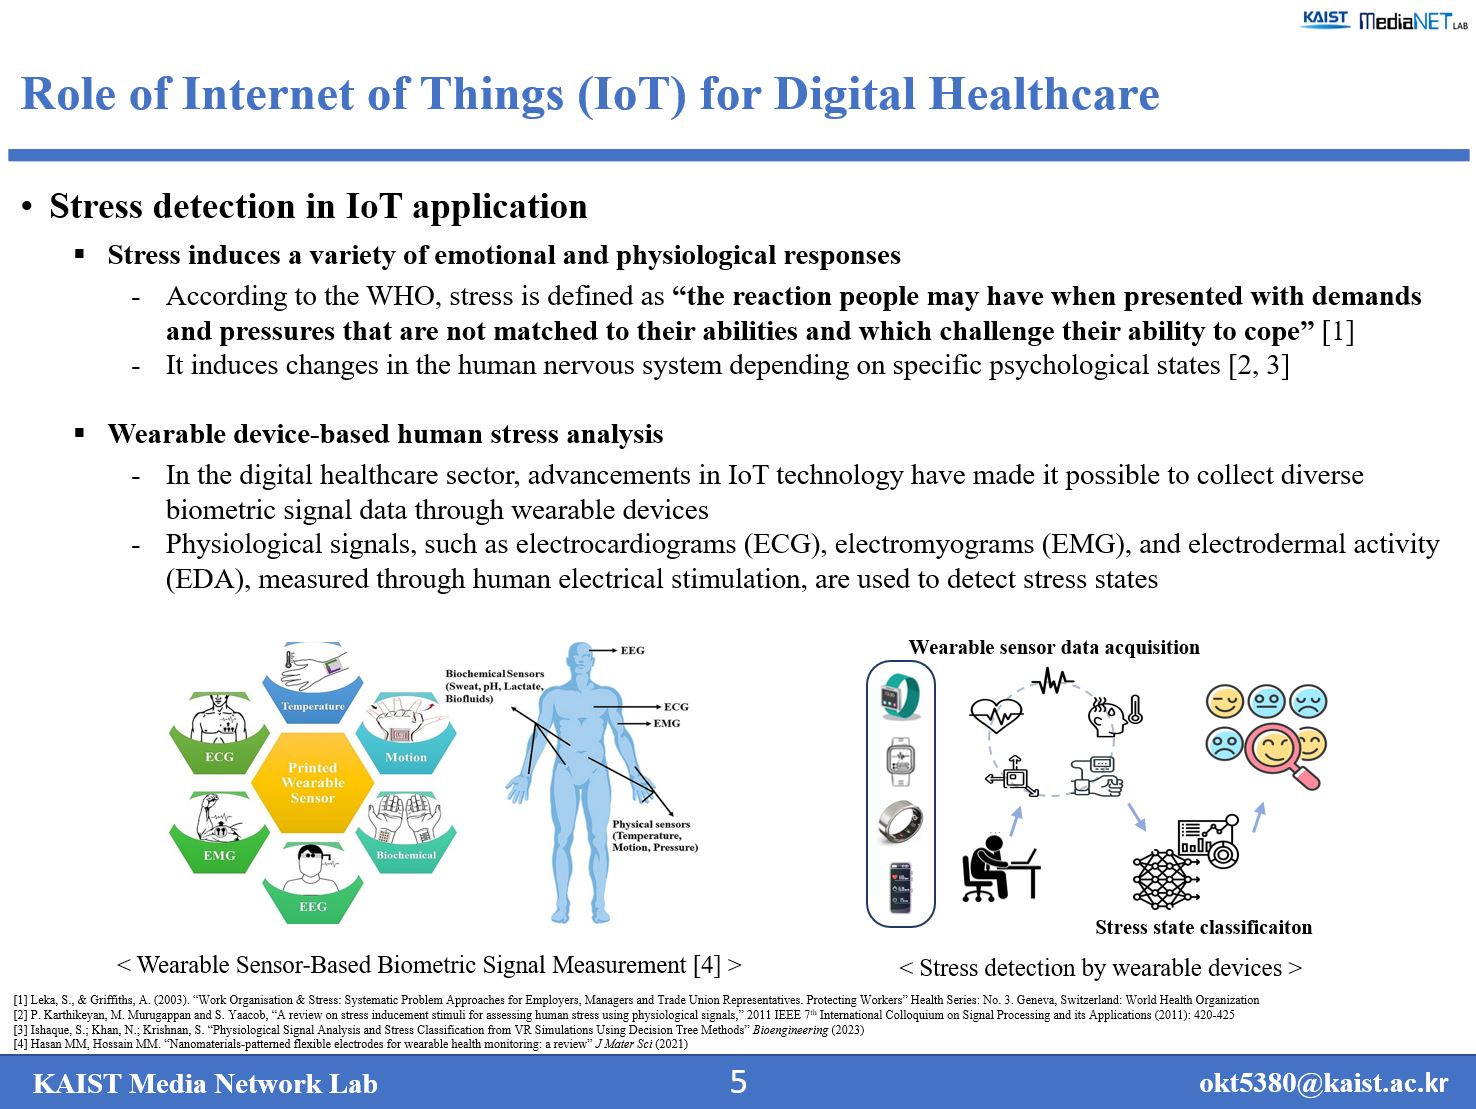 |
Stress induces a variety of emotional and physiological responses. According to the WHO, stress is defined as "the reaction people may have when presented with demands and pressures that are not matched to their abilities and which challenge their ability to cope". It induces changes in the human nervous system depending on specific psychological states.
As i said earlier, advancements in IoT technology have made it possible to collect diverse biometric signal data through wearable devices
And these signals measured through human electrical stimulation can be used to detect stress states.
|
|
ICACT20250013 Slide.04
[Big slide for presentation]
|
Chrome Text-to-Speach Click!! |
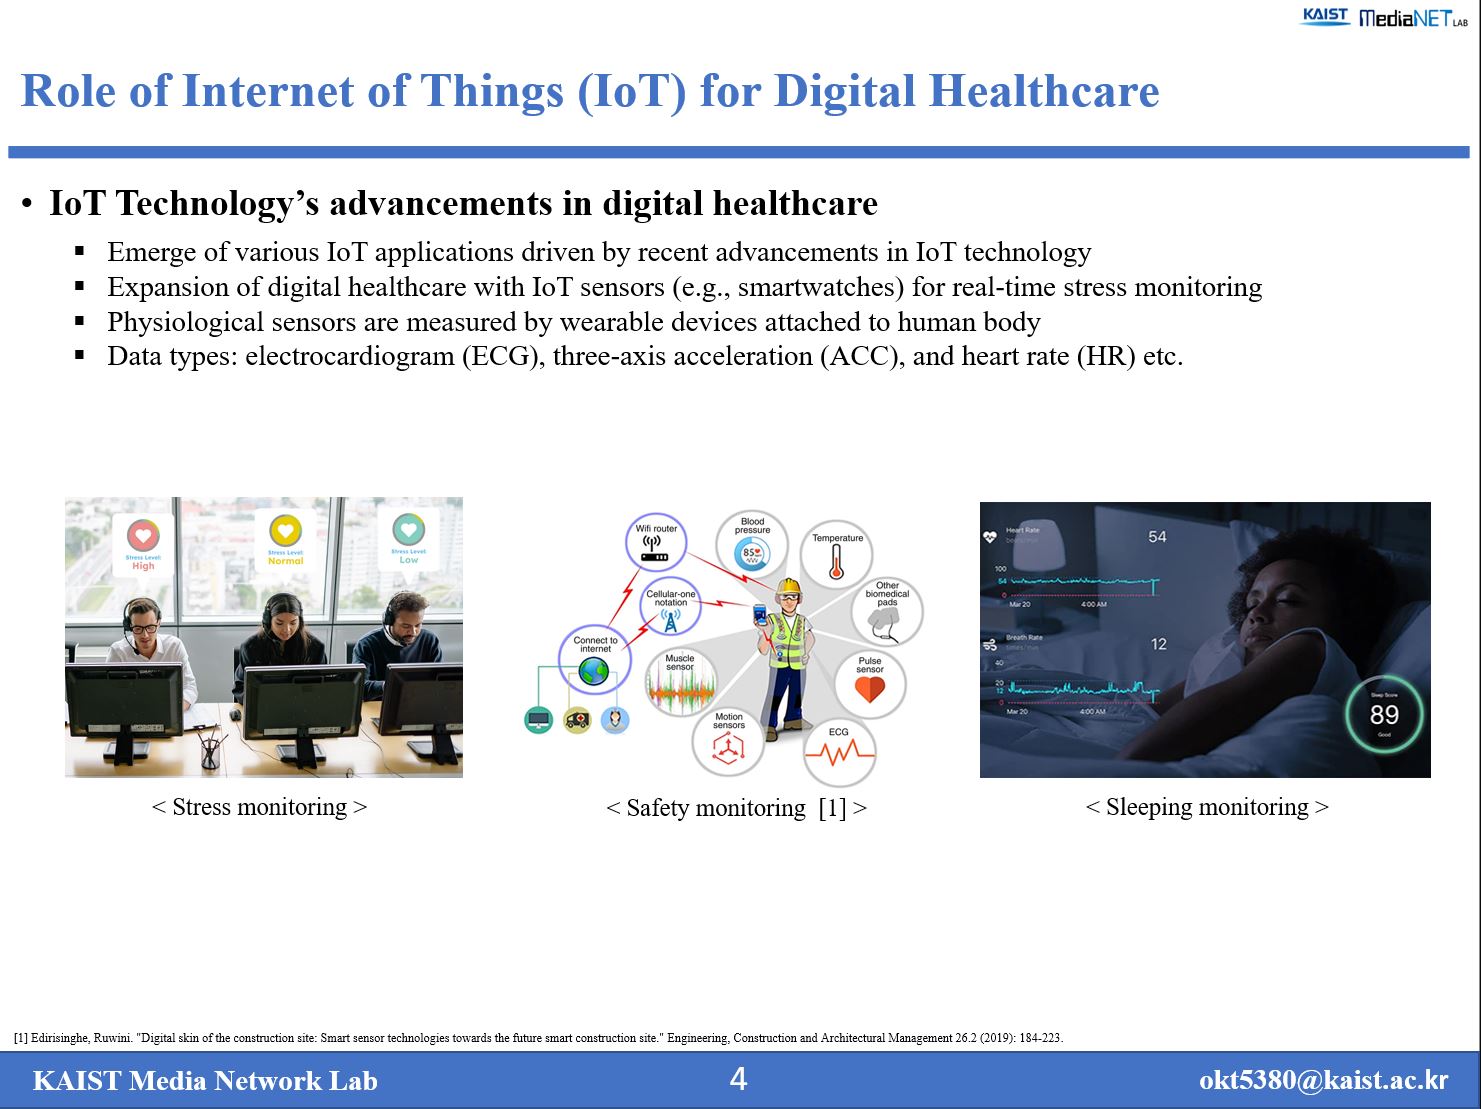 |
Internet of Things (IoT) has enabled major advancements that are shaping digital healthcare services. We can now track various physiological signals—such as ECG and heart rate—in real time with wearable devices. By leveraging these signals, digital healthcare applications like stress monitoring, safety monitoring at worksites, and even sleep quality assessment can be implemented.
|
|
ICACT20250013 Slide.03
[Big slide for presentation]
|
Chrome Text-to-Speach Click!! |
 |
Let’s begin with the Introduction.
|
|
ICACT20250013 Slide.02
[Big slide for presentation]
|
Chrome Text-to-Speach Click!! |
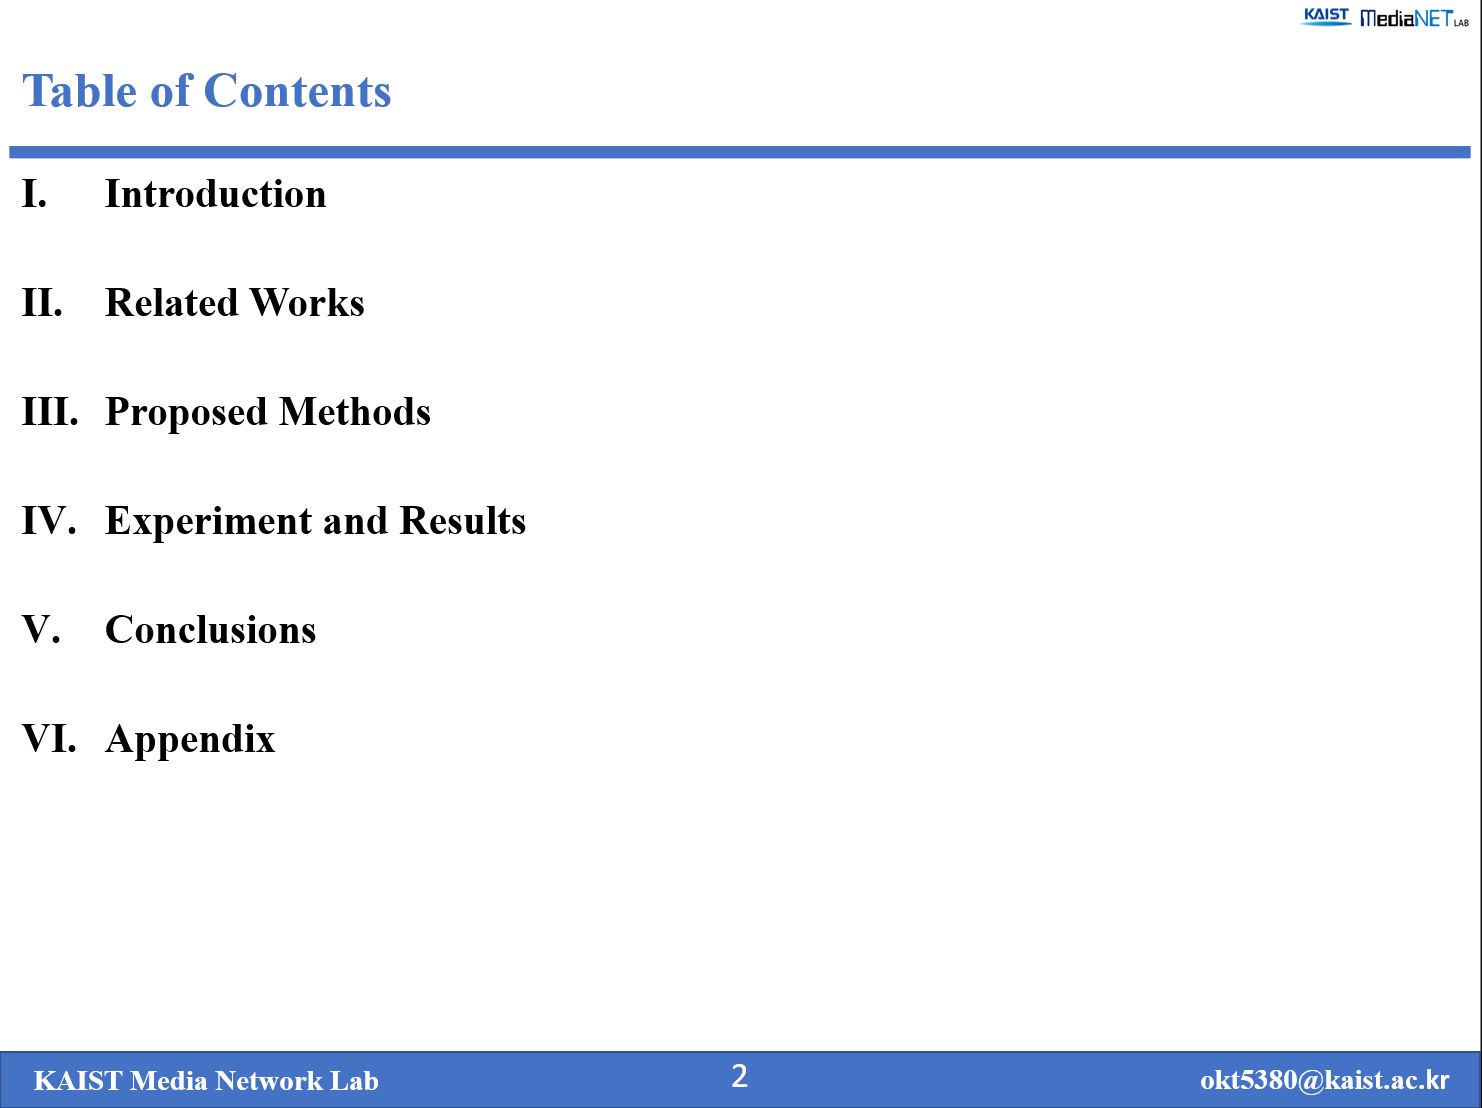 |
Here is the outline of my presentation. First, I will go over the Introduction section, where I’ll discuss the background and motivation for our study. Then, I’ll walk you through each of the remaining sections in order.
|
|
ICACT20250013 Slide.01
[Big slide for presentation]
|
Chrome Text-to-Speach Click!! |
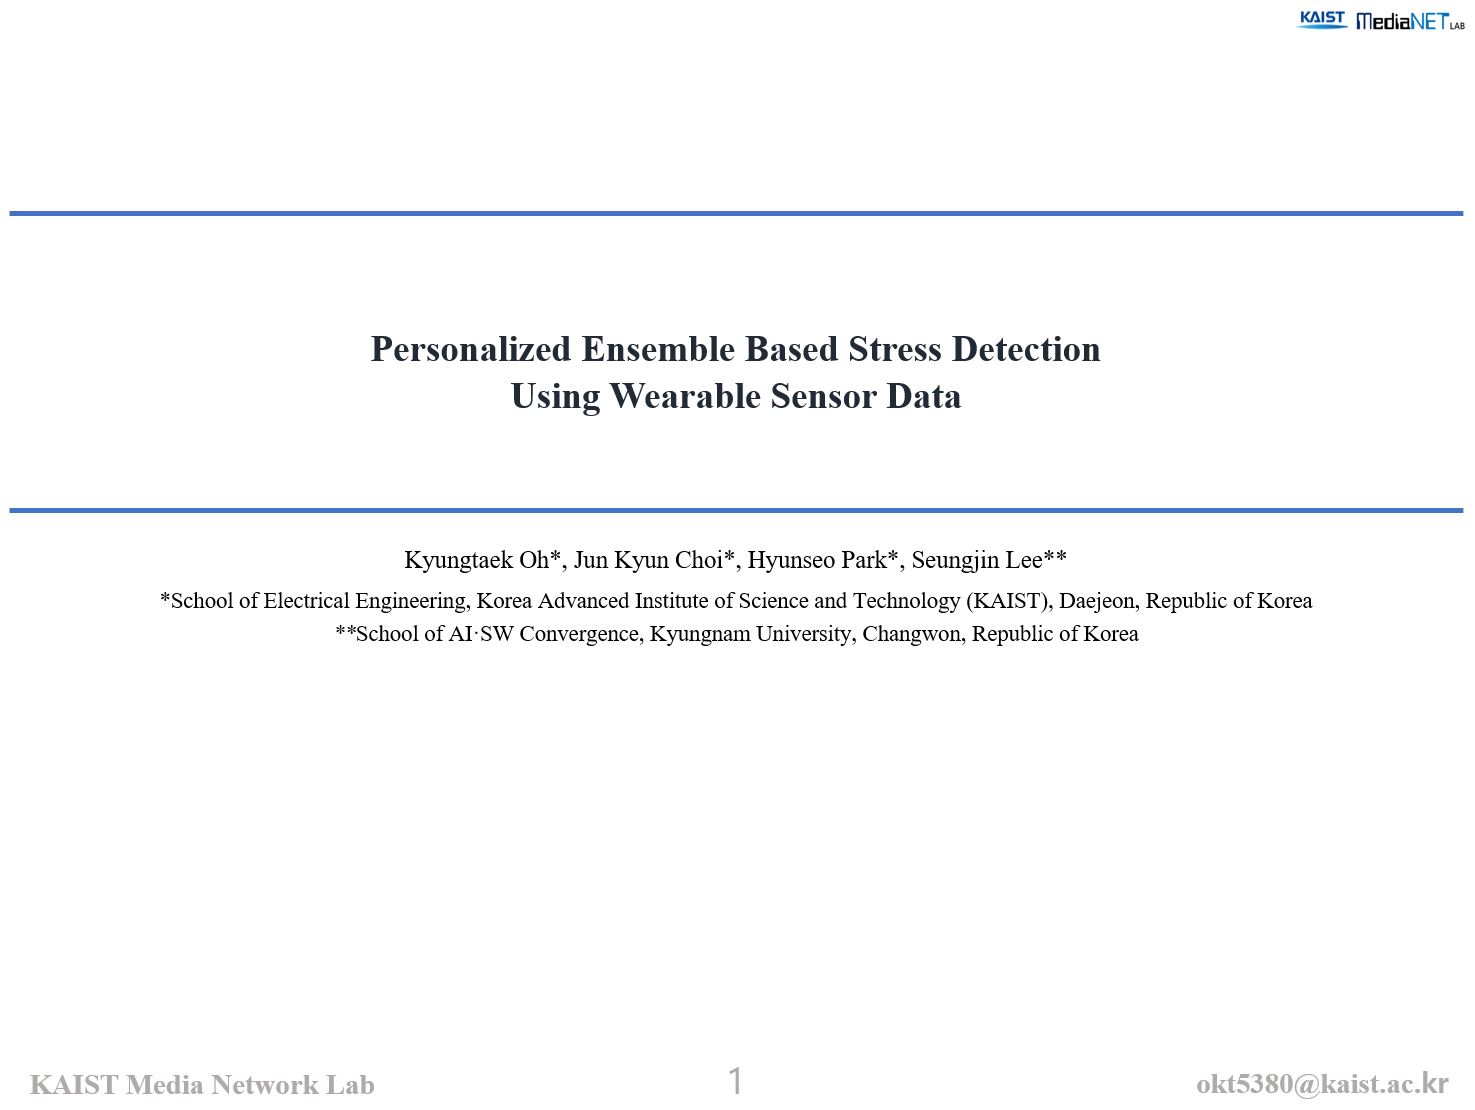 |
Hello everyone! My name is KyungTaek Oh, and I have recently completed my Master's degree at KAIST. I’d like to introduce our paper titled “Personalized Ensemble-Based Stress Detection Using Wearable Sensor Data.”
|