ICACT20230188 Slide.01
[Big Slide] ICACT20230188 Slide.01
[Big Slide]
|
Chrome  Click!! Click!! |
 |
Hi everybody, my name is Viet-Vu Vu. For ICACT 2023, we present our work "Density peak clustering evaluation", in which we extensively analyze the performance of DPC algorithm and evaluate DPC’s advantages and disadvantages.
|
| ICACT20230188 Slide.02
[Big Slide]
|
Chrome Click!! |
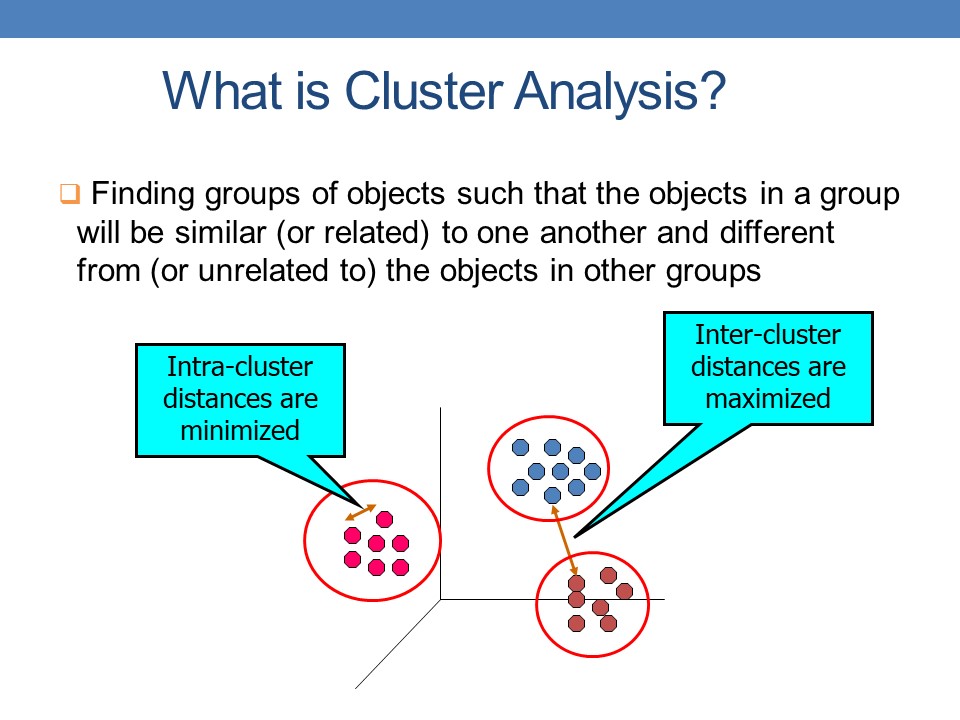 |
First of all, although clustering analysis has been studied in nearly 70 years, it has attracted a lot of attention these days because of the need of new adaptation clustering method to real KDD applications.
The aim of clustering algorithm is to divide X into k groups, called clusters, such that the points in the same cluster are similar and the points in different clusters are dissimilar. |
| ICACT20230188 Slide.03
[Big Slide]
|
Chrome Click!! |
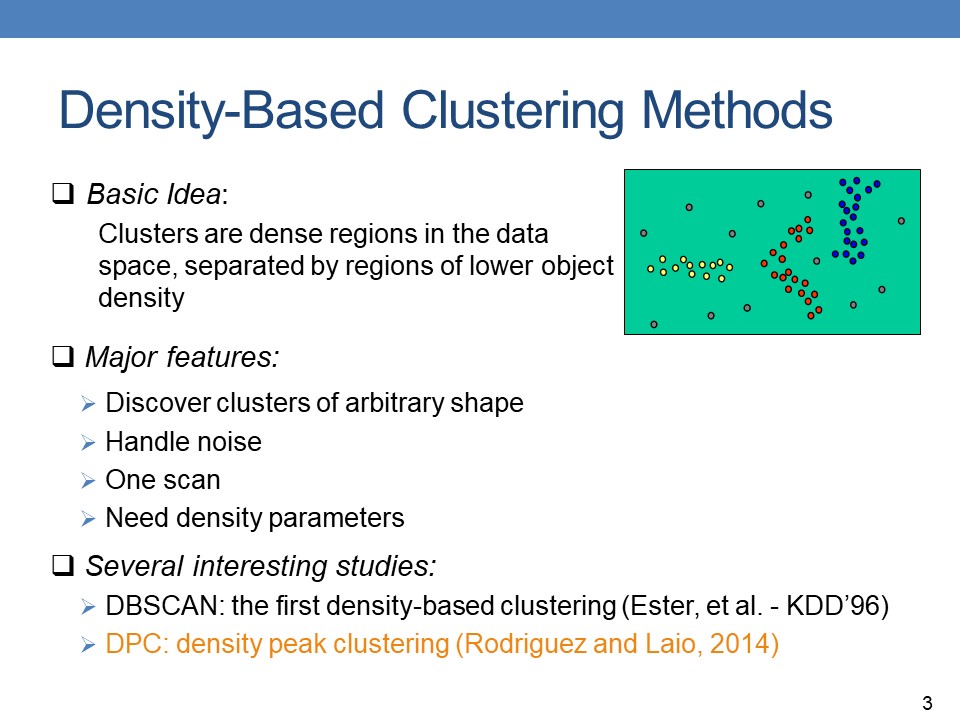 |
Among different clustering techniques, including Centroid-based, Graph-based, and Density-based, the Density-Based Clustering Methods received lots of attentions.
Basic idea of density-based clustering is that Clusters are dense regions in the data space, separated by regions of lower object density. These methods could be great since they are able to:
- Discover clusters of arbitrary shape
- Handle noise
- One scan
However, it should be mentioned that these methods Need density parameters.
Here two interesting studies over the years: DBSCAN is the first density-based clustering proposed in 1996 and recently the density peak clustering DPC proposed in 2014. |
| ICACT20230188 Slide.04
[Big Slide]
|
Chrome Click!! |
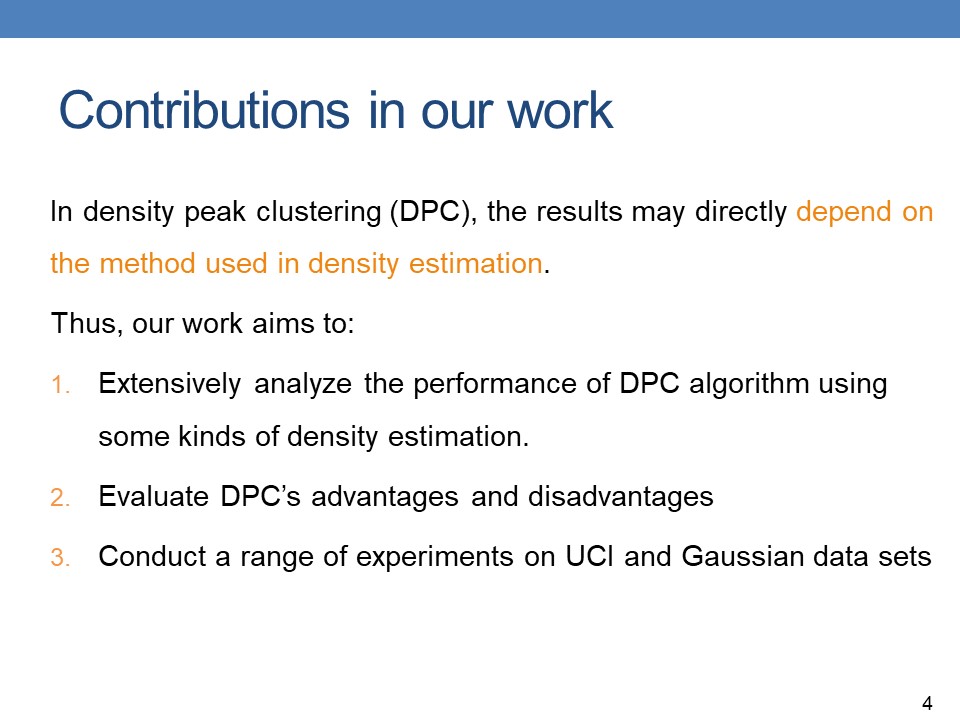 |
In density peak clustering (DPC), the results may directly depend on the method used in density estimation.
Thus, our work aims to:
Extensively analyze the performance of DPC algorithm
Evaluate DPC’s advantages and disadvantages
Conduct a range of experiments on UCI and Gaussian data sets |
| ICACT20230188 Slide.05
[Big Slide]
|
Chrome Click!! |
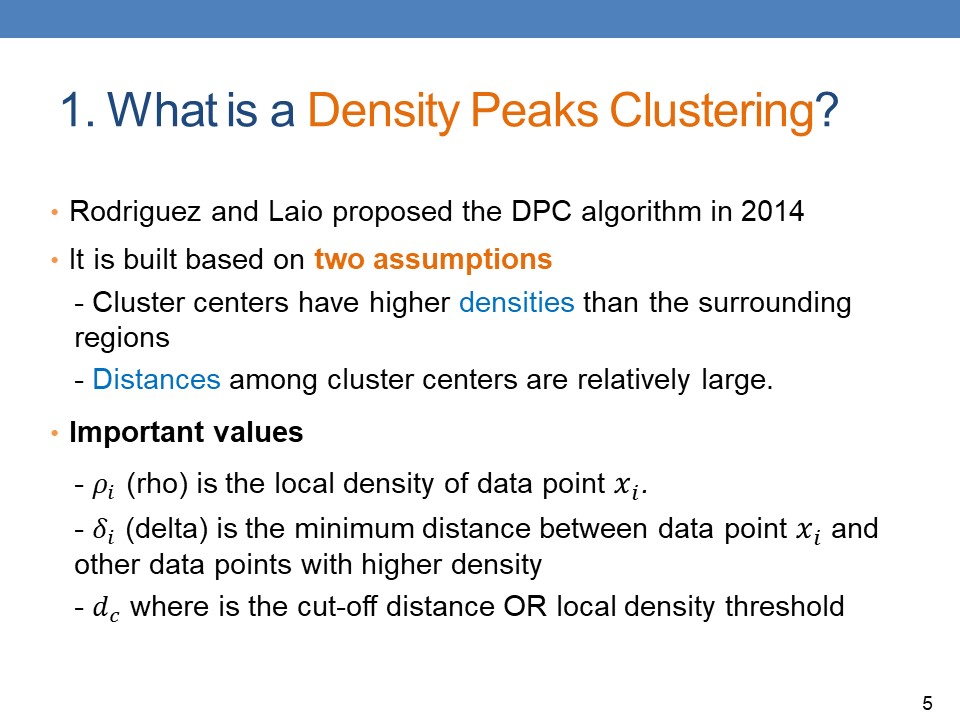 |
Rodriguez and Laio proposed the DPC algorithm in 2014
It is built based on two assumptions
- Cluster centers have higher densities than the surrounding regions
- Distances among cluster centers are relatively large.
There are three important values in the DPC algorithm
- rho is the local density of data point 𝑥_𝑖.
- delta is the minimum distance between data point 𝑥_𝑖 and other data points with higher density
- 𝑑_𝑐 where is the cut-off distance OR local density thresh |
| ICACT20230188 Slide.06
[Big Slide]
|
Chrome Click!! |
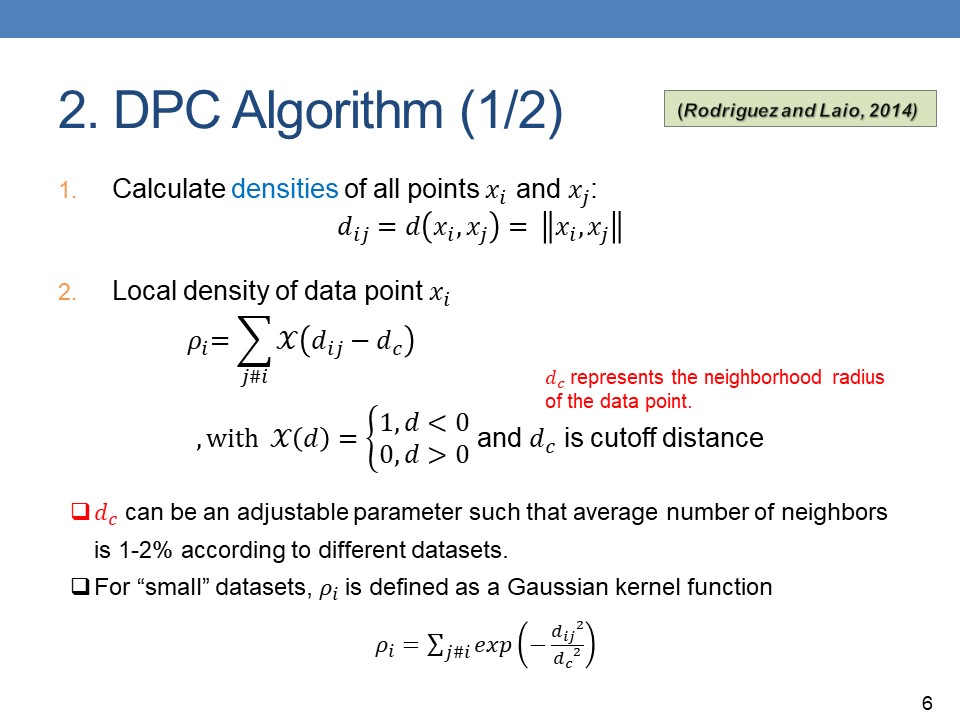 |
The DPC algorithm can be summarized into 6 steps as following.
First, Calculate densities of all points 𝑥_𝑖 and 𝑥_𝑗.
Second, Calculate Local density of data point 𝑥_𝑖
Here, 𝑑_𝑐 represents the neighborhood radius of the data point and it can be an adjustable parameter such that average number of neighbors is 1-2% according to different datasets.
For “small” datasets, rho is defined as a Gaussian kernel function. |
| ICACT20230188 Slide.07
[Big Slide]
|
Chrome Click!! |
 |
Next, in the third step we need to Calculate minimum distances of 𝑥_𝑖 to their nearest point 𝑥_𝑗 with higher density rho.
And in the fourth step, we Plot decision graph and select cluster centers.
After that, we can Assign each remaining point to the nearest cluster center.
The sixth step, that is detecting outliers could be an optional. In this step, non-labeled points are assigned to the same cluster label as their nearest neighbor point according to a recursive equation as shown. |
| ICACT20230188 Slide.08
[Big Slide]
|
Chrome Click!! |
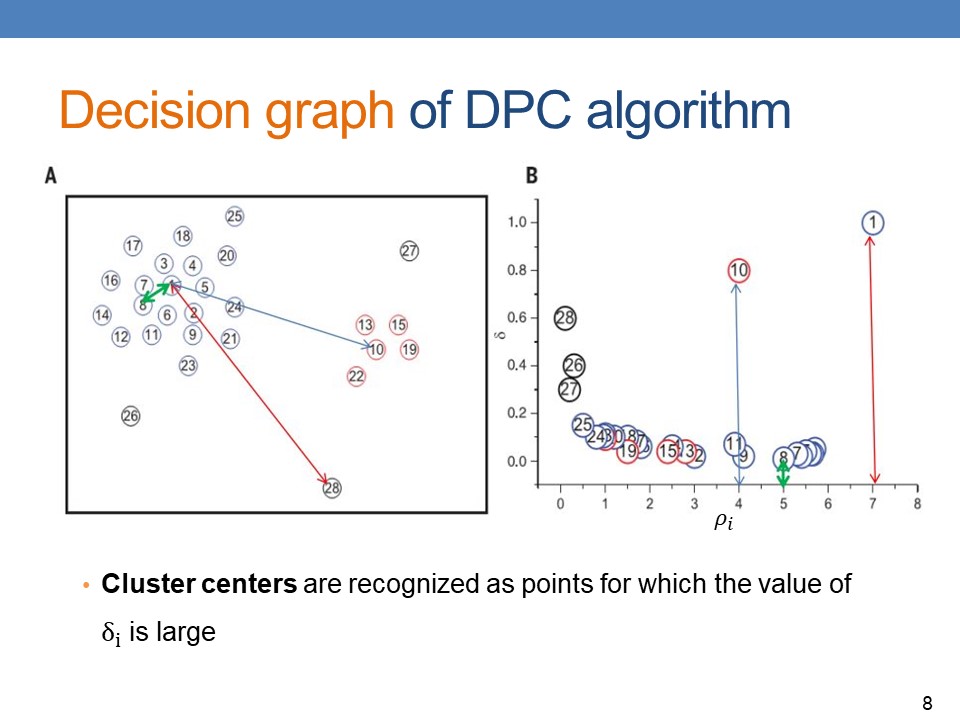 |
When plotting the Decision Graph of DPC algorithm, Cluster centers are recognized as points for which the value of δ_i is large
In other words, the DPC algorithm intends to utilize the relative density relationship, but not the absolute density value, to accomplish the clustering. |
| ICACT20230188 Slide.09
[Big Slide]
|
Chrome Click!! |
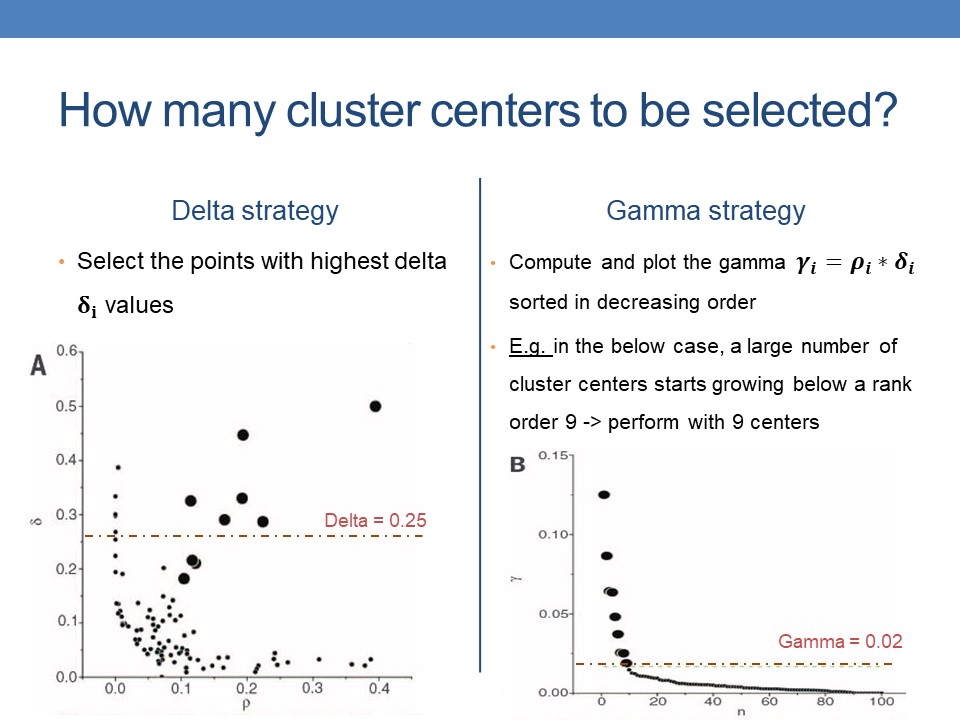 |
So the question is: How many cluster centers to be selected?
There are two different strategies that we can apply here.
We select the points with highest delta values in Delta Strategy
Or Compute and plot the gamma =rho∗delta, sorted in decreasing order in the Gamma strategy |
| ICACT20230188 Slide.10
[Big Slide]
|
Chrome Click!! |
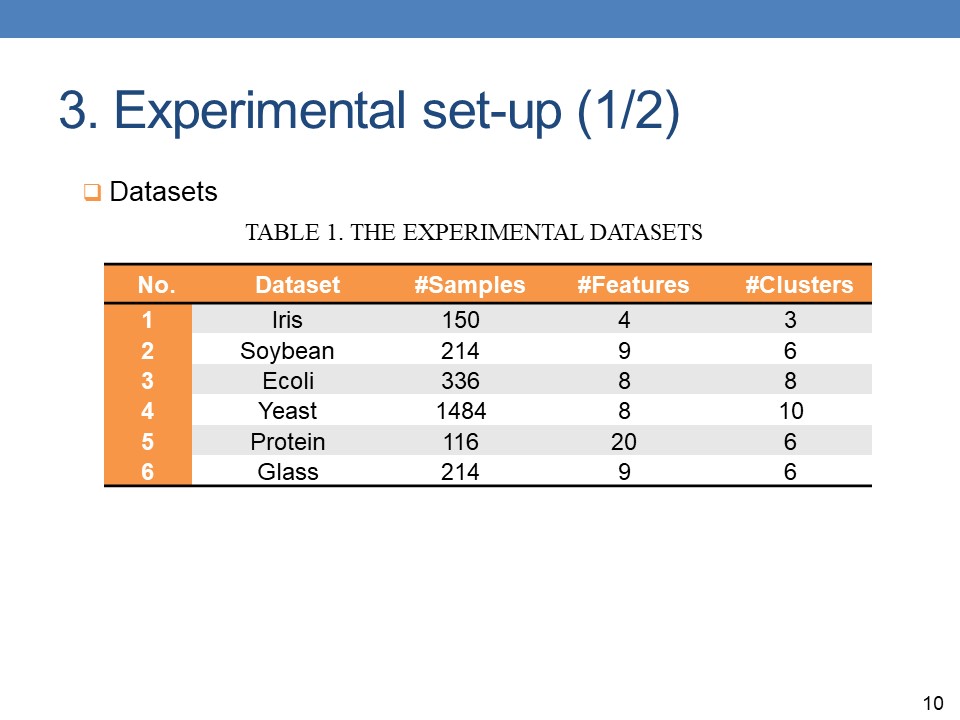 |
To evaluate the efficiency of DPC algorithm, we use 6 real-world datasets from UCI. These UCI datasets are widely used in the research community to compare and evaluate the clustering quality. Details of the datasets are given in Table 1. |
| ICACT20230188 Slide.11
[Big Slide]
|
Chrome Click!! |
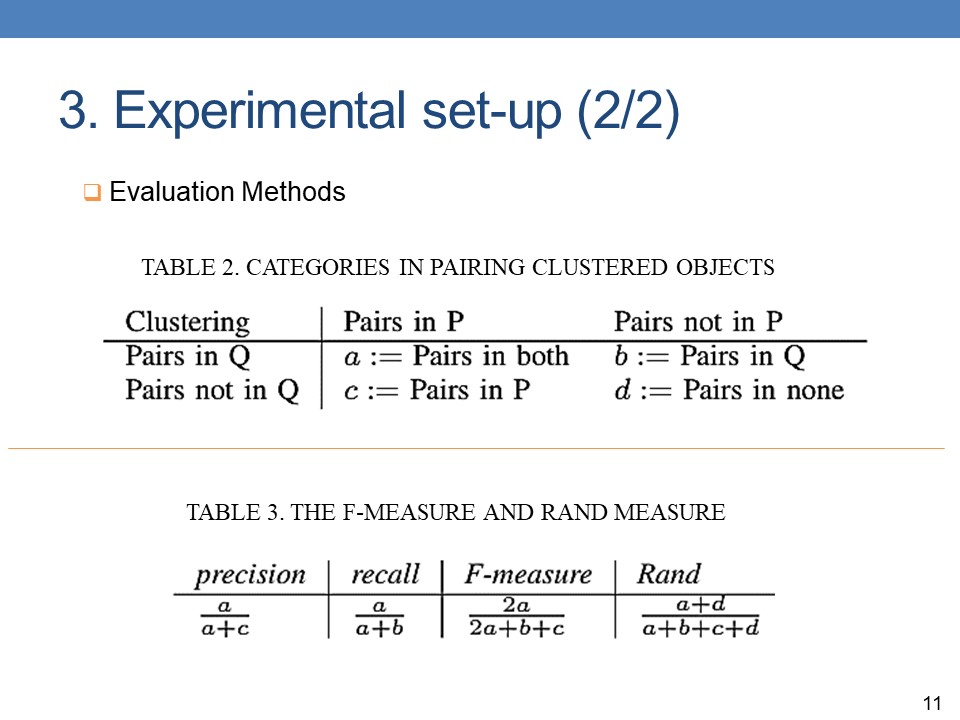 |
To compare two partitions of clustering, in this paper, we use two methods including Rand measure and F-measure. Given two partitions P and Q to compare, the idea of these methods is based on comparing their common and their different sets of pairs. The detail of these methods is shown in Table 2 and Table 3. |
| ICACT20230188 Slide.12
[Big Slide]
|
Chrome Click!! |
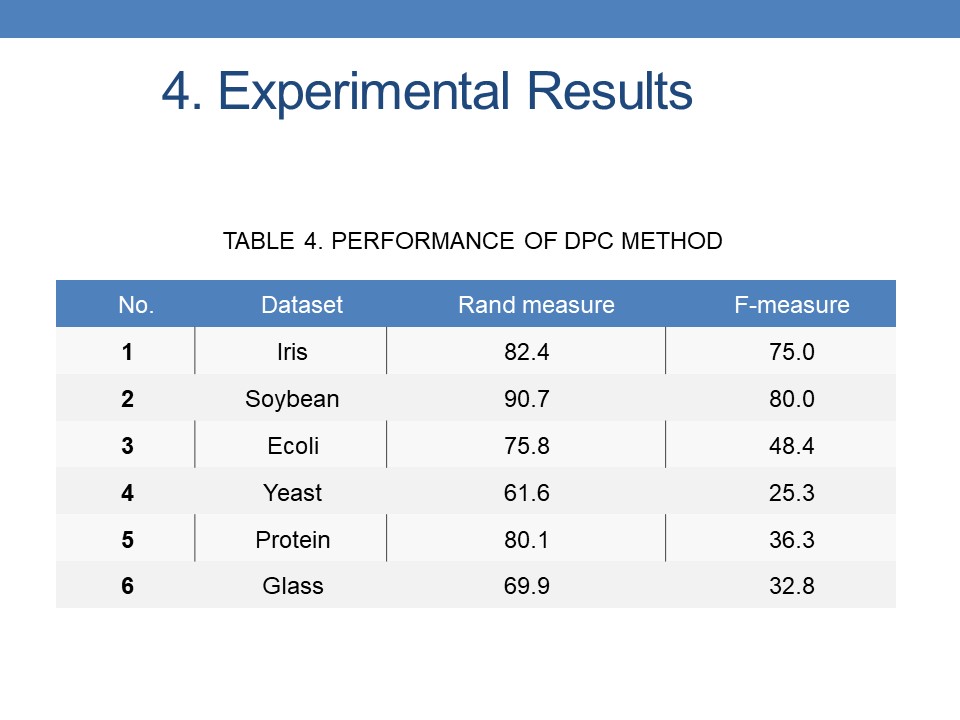 |
The results of clustering used DPC are shown in the table 4. We have tried with two methods of local density evaluation as mentioned above; the maximum results of 2 method used are presented in the table 4. The Rand measure achieved the good performance, however the F-measure for Ecoli, Yeast, Protein and Glass is quite low. It cans be explained by the fact that those data set are highly overlap between clusters. The DPC with propagation label method make a lot of errors. We need further research for improving the performance of DPC in this case. Moreover, the method that choosing the right peaks needs being enhanced. |
| ICACT20230188 Slide.13
[Big Slide]
|
Chrome Click!! |
 |
The advantage of the DPC algorithm is that it uses only one parameter, and the step of assigning label needs to traverse the data one time. DPC algorithm can detect clusters of different sizes, shapes. |
| ICACT20230188 Slide.14
[Big Slide]
|
Chrome Click!! |
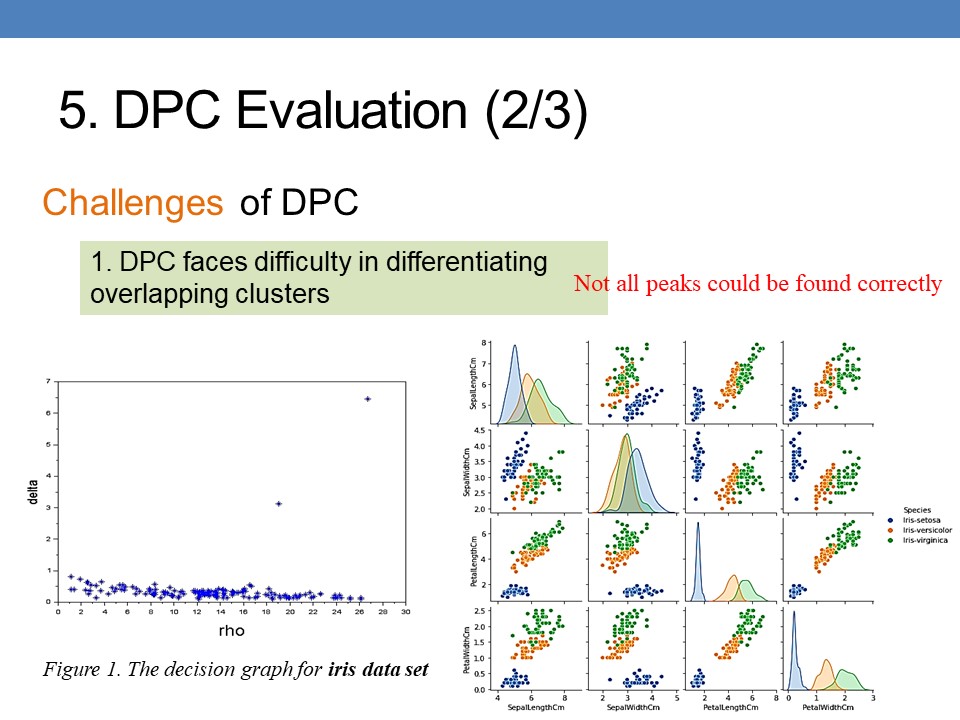 |
However, DPC faces difficulty in differentiating overlapping clusters. For such type of datasets, not all peaks could be found. For example, in the figure 1, the Iris data set with 3 clusters, however, we see that there are only 2 peaks candidates. |
| ICACT20230188 Slide.15
[Big Slide]
|
Chrome Click!! |
 |
Another factor that can affect the results is the definition of local density and cut off distance. Local density of data points can be affected by the cut off distance, which can influence the clustering results, especially on small-scale datasets while this value is set by personal experience or at random. |
| ICACT20230188 Slide.16
[Big Slide]
|
Chrome Click!! |
 |
In this paper, we have conducted a range of experiments to evaluate the performance of DPC.
Although the DPC has obtained some good results, however some problem needs to be studied as follows:
DPC do not work well if the data set has some overlap clusters.
The method for choosing peaks should improve. If the data set has different densities, DPC will make some mistakes.
We suggest some direction research in near future such as building hybrid method for DPC, i.e., combining DPC with some optimization methods, or develop some kind of semi-supervised DPC clustering algorithms. |
| ICACT20230188 Slide.17
[Big Slide]
|
Chrome Click!! |
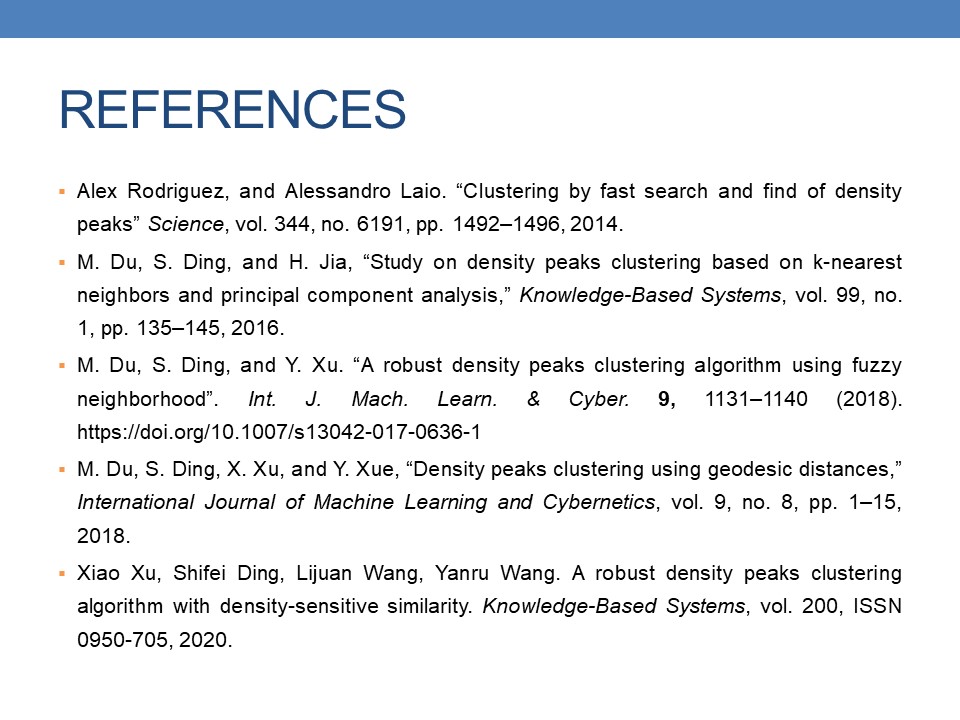 |
Lastly, I would like to enclose some references. |
| ICACT20230188 Slide.18
[Big Slide]
|
Chrome Click!! |
 |
Thank you for your attention! |