Now 57 visitors
Today:441 Yesterday:647
Total: 68396
S 0P 0R
2025-04-18, Week 16 |
| TACT Journal Page |
| Call for Paper |
| Author Page |
| Paper Procedure |
| Paper Submission |
| Registration |
| Welcome Message |
| Statistics |
| Committee |
| Paper Archives |
| Outstanding Papers |
| Author Page |
| - Paper Procedure |
| - Journal Procedure |
| - Presentation Tips |
|
| Proceedings |
| Program with Papers |
| Plenary Session |
| Tutorial Session |
|
| Presentation Assistant |
| Hotel & Travel Info |
| About Korea |
| Accommodation |
| Transportation |
| VISA |
| Other Infomation |
|
| Photo Gallery |
| FAQ |
| Member Login |
| Scheduler Login |
| Seminar |
| Archives Login |
|
| Sponsors |

|

|

|

|

|

|

|

|

|

|

|

|
|
|
|
|
 ICACT20240429 Slide.00
[Big Slide] ICACT20240429 Slide.00
[Big Slide]
|
Chrome  Click!! Click!! |
 |
Time-frequency Analysis for Validating Prognostics Algorithms of Rolling Element Bearings
Guanhua Zhu*, Xiaoling Xu**, Qing Zhong **, Bing-Yuh Lu**, Yushen Lu **, Guangming Xu **, Yumeng Zhou **, Ziyi Jiang **,Kai Sun **, Minhao Wang **
*Guangdong Provincial Key Lab. of Petrochemical Equipment and Fault Diagnosis, Guangdong University of Petrochemical Technology, Maoming City, Guangdong, China
**Faculty of Automation, Guangdong University of Petrochemical Technology, Maoming City, Guangdong, China
|
| ICACT20240429 Slide.01
[Big Slide]
|
Chrome Click!! |
 |
This study employed the time-frequency analysis to compute some of the XJTU-SY bearing datasets which are supported by the Institute of Design Science and Basic Component at Xi’an Jiaotong University (XJTU), Shaanxi, P.R. China and the Changxing Sumyoung Technology Co., Ltd. (SY), Zhejiang, P.R. China [1].
Time-frequency analysis owns the benefits of the obvious presentation of the fundamental and harmonic components of a segment of a signal. Therefore, some problems of the rolling elements can be detected by this analysis because of the periodic touches in the disordered place of the rotation of the roller.
Therefore, we propose the method of time-frequency analysis to be the pre-processing for validating prognostics algorithms of rolling element bearings.
|
| ICACT20240429 Slide.02
[Big Slide]
|
Chrome Click!! |
 |
Prognostics and health management (PHM) is very helpful to (1) ensure the safe operation of machinery, (2) improve the productivity, and (3) increase economic benefits [2].
Wu et al. have developed a hybrid deep-learning model based on CNN and gcForest [3].
Yao et al. proposed a method using the ability of the 1D-CNN to extract signal features of the signals in the XJTU-SY bearing datasets [4].
Zhao et al. [5] proposed a method of the signal-to-signal translation into the field of data-driven fault diagnosis of bearings and gears.
|
| ICACT20240429 Slide.03
[Big Slide]
|
Chrome Click!! |
 |
However, the applications of time-frequency analysis were widely used in many fields, such as lung sound diagnosis [9–11] and speech recognition [12-14].
Furthermore, the spectrogram is a very crucial tool to display the results of time-frequency analysis. Therefore, some studies related to the XJTU-SY bearing datasets inserted spectrograms as a method for analysis.
Zhang et al. employed the data of the spectrogram as an input of improved ConvNext [15].
Cheng et al. compared the spectrograms between trained and untrained data [16]. The function of the spectrogram supported an efficient method to the studies.
|
| ICACT20240429 Slide.04
[Big Slide]
|
Chrome Click!! |
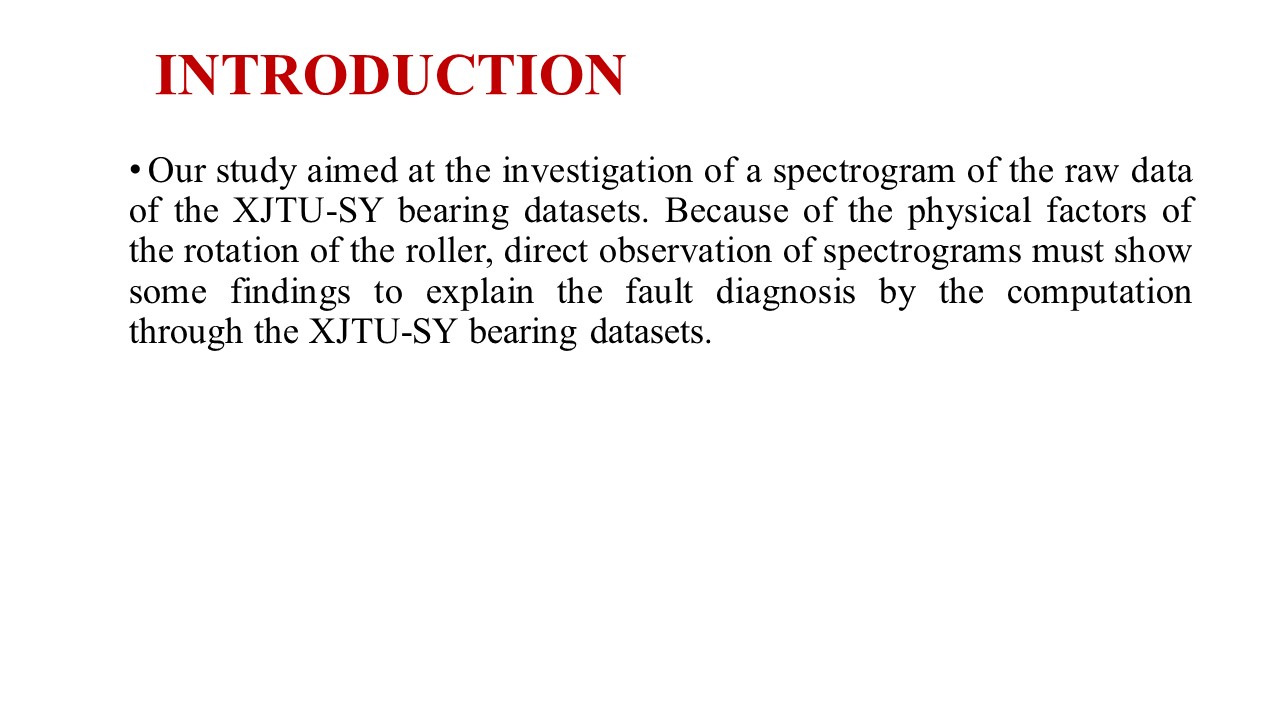 |
Our study aimed at the investigation of a spectrogram of the raw data of the XJTU-SY bearing datasets. Because of the physical factors of the rotation of the roller, direct observation of spectrograms must show some findings to explain the fault diagnosis by the computation through the XJTU-SY bearing datasets.
|
| ICACT20240429 Slide.05
[Big Slide]
|
Chrome Click!! |
 |
The methods of this study are divided into 4 parts:
(1) spectrogram,
(2) XJTU-SY bearing datasets,
(3) equipment and,
(4) 2D correlation.
|
| ICACT20240429 Slide.06
[Big Slide]
|
Chrome Click!! |
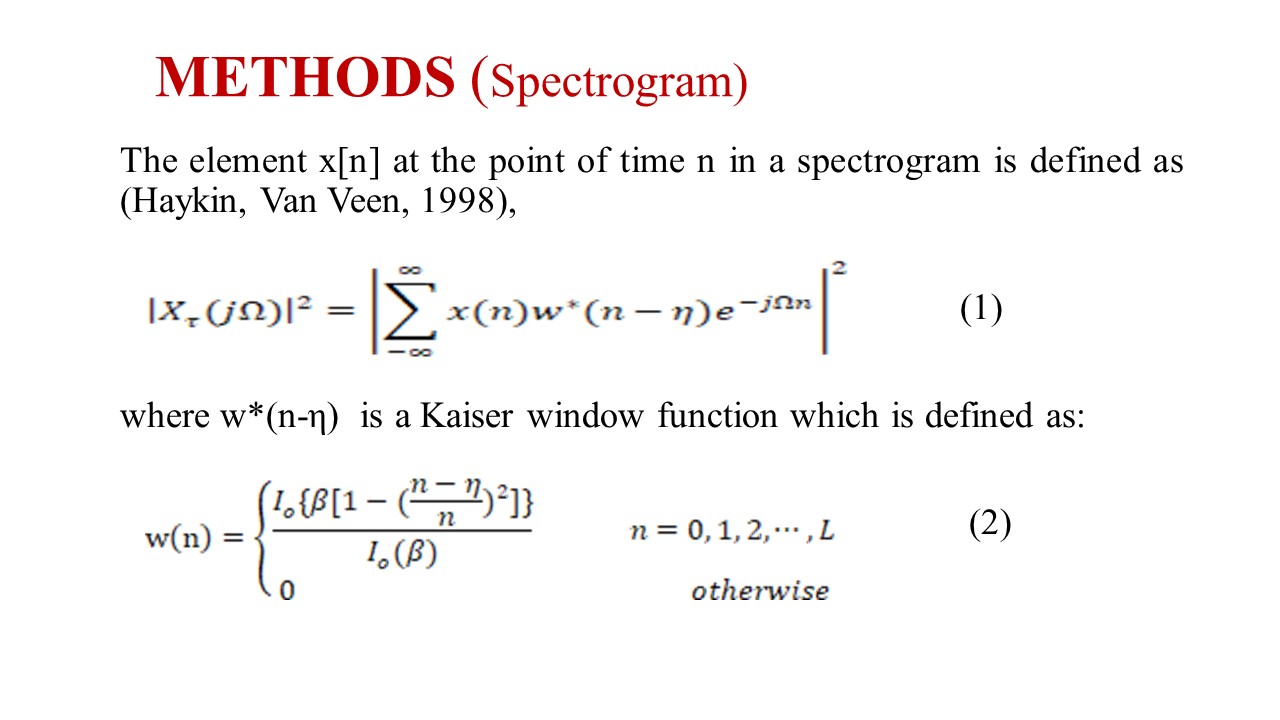 |
The element x[n] at the point of time n in a spectrogram is defined as (Haykin, Van Veen, 1998) equation 1.
where w*(n-η) is a Kaiser window function which is defined as equation 2.
|
| ICACT20240429 Slide.10
[Big Slide]
|
Chrome Click!! |
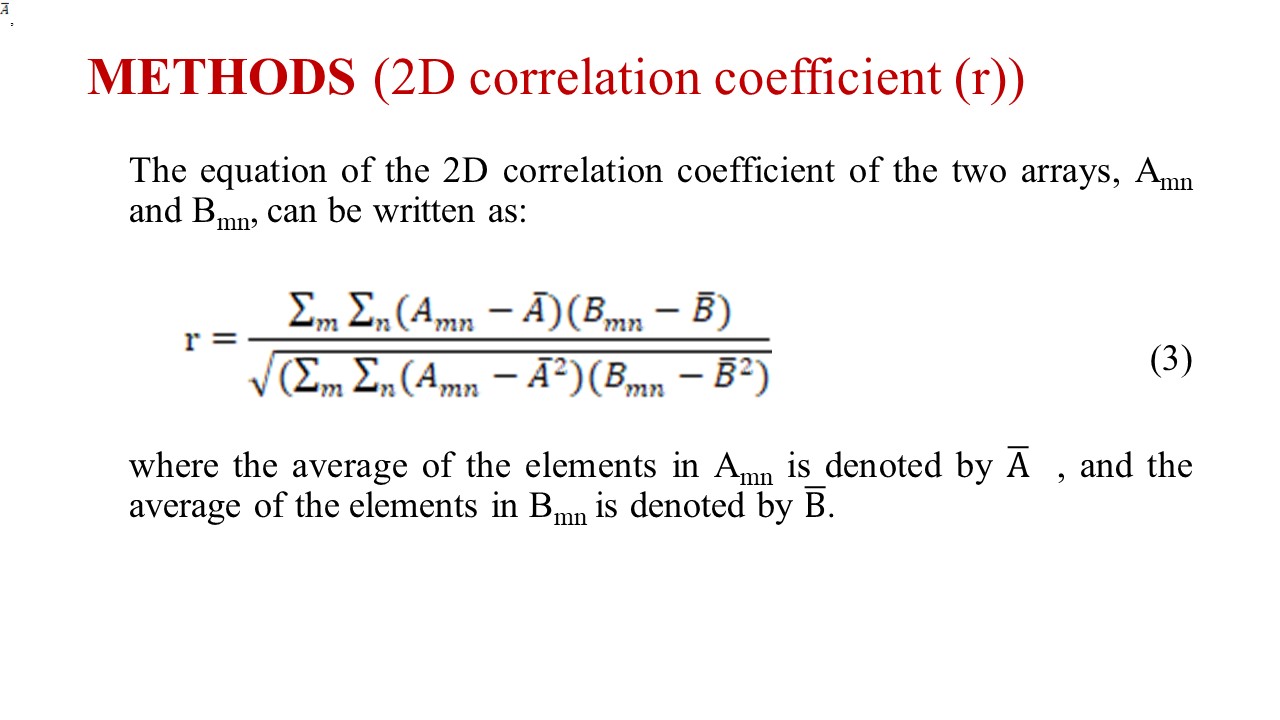 |
The equation of the 2D correlation coefficient of the two arrays, Amn and Bmn, can be written as equation 3,
where the average of the elements in Amn is denoted by A ̅ , and the average of the elements in Bmn is denoted by B ̅.
|
| ICACT20240429 Slide.12
[Big Slide]
|
Chrome Click!! |
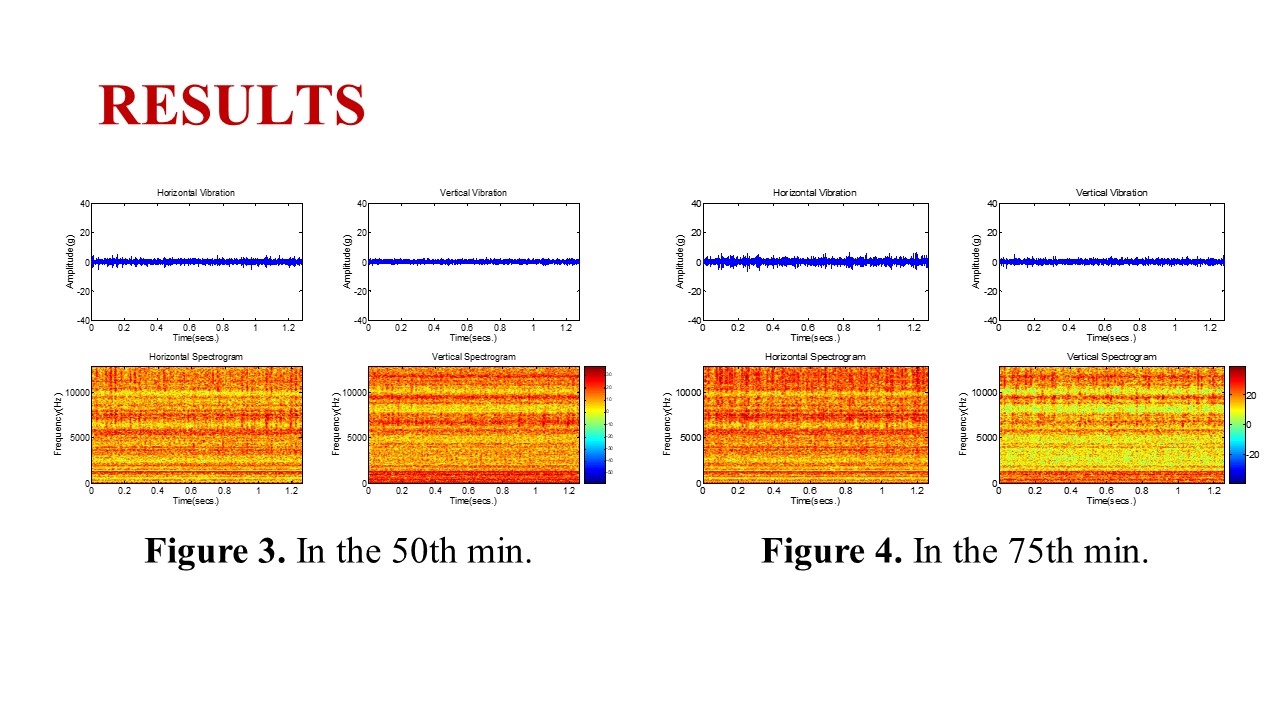 |
Figure 3. In the 50th min.
Figure 4. In the 75th min.
|
| ICACT20240429 Slide.15
[Big Slide]
|
Chrome Click!! |
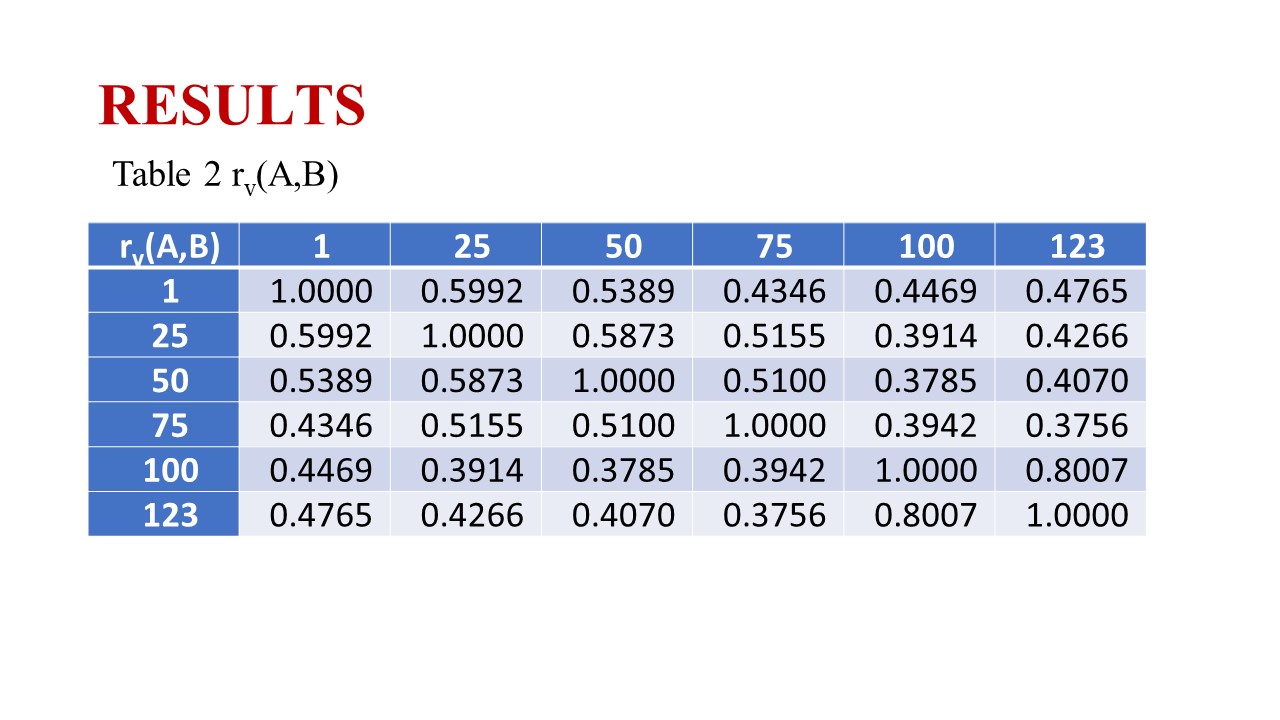 |
Table 2 rv(A,B)
|
| ICACT20240429 Slide.16
[Big Slide]
|
Chrome Click!! |
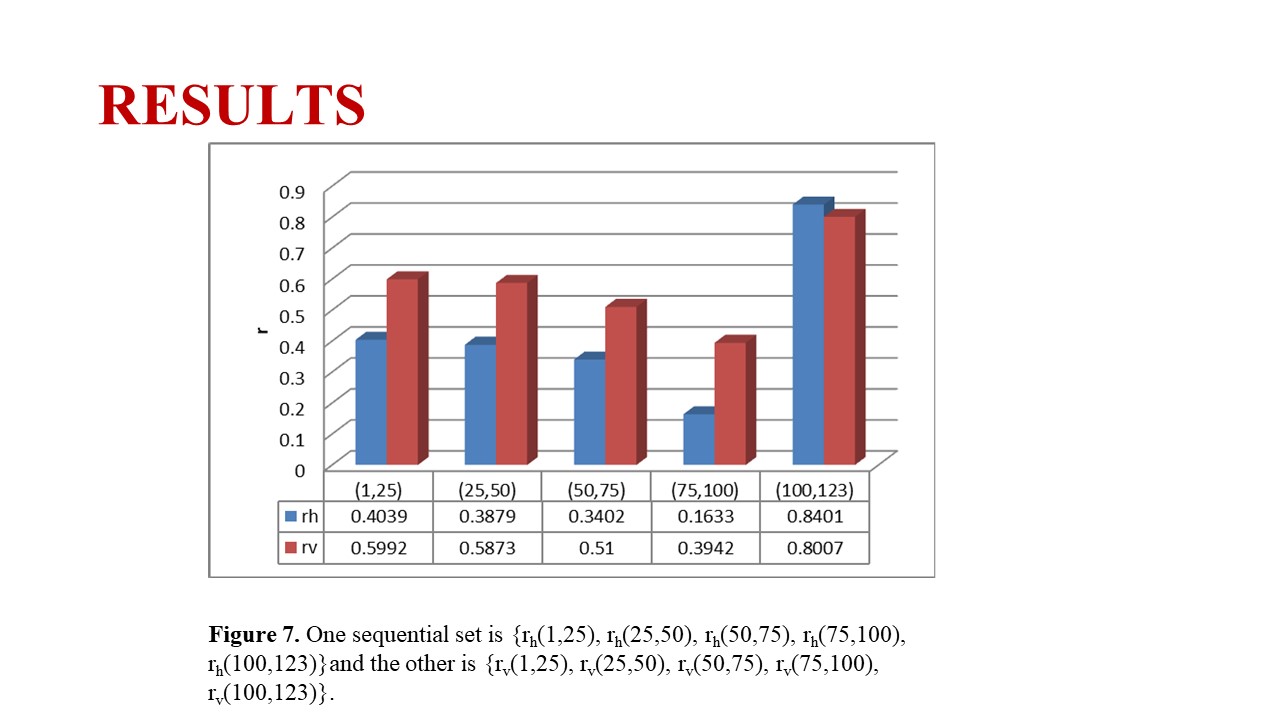 |
Figure 7. One sequential set is {rh(1,25), rh(25,50), rh(50,75), rh(75,100), rh(100,123)}and the other is {rv(1,25), rv(25,50), rv(50,75), rv(75,100), rv(100,123)}.
|
| ICACT20240429 Slide.17
[Big Slide]
|
Chrome Click!! |
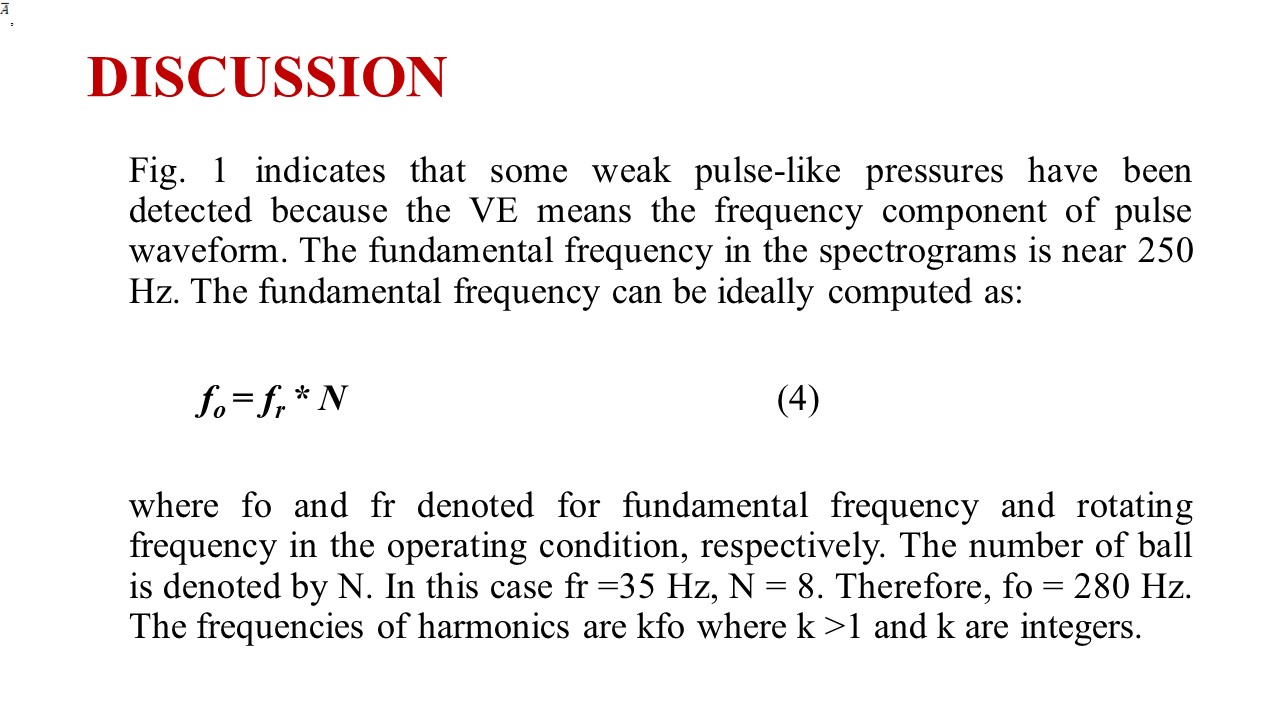 |
Fig. 1 indicates that some weak pulse-like pressures have been detected because the VE means the frequency component of pulse waveform. The fundamental frequency in the spectrograms is near 250 Hz. The fundamental frequency can be ideally computed as:
fo = fr * N (4)
where fo and fr denoted for fundamental frequency and rotating frequency in the operating condition, respectively. The number of ball is denoted by N. In this case fr =35 Hz, N = 8. Therefore, fo = 280 Hz. The frequencies of harmonics are kfo where k >1 and k are integers.
|
| ICACT20240429 Slide.21
[Big Slide]
|
Chrome Click!! |
 |
Thank you! |
| |