 |
Until now we have developed many BI tools. Adding to these developments,
we developed more easily operational web-based BI tools in reference 1 and 2.
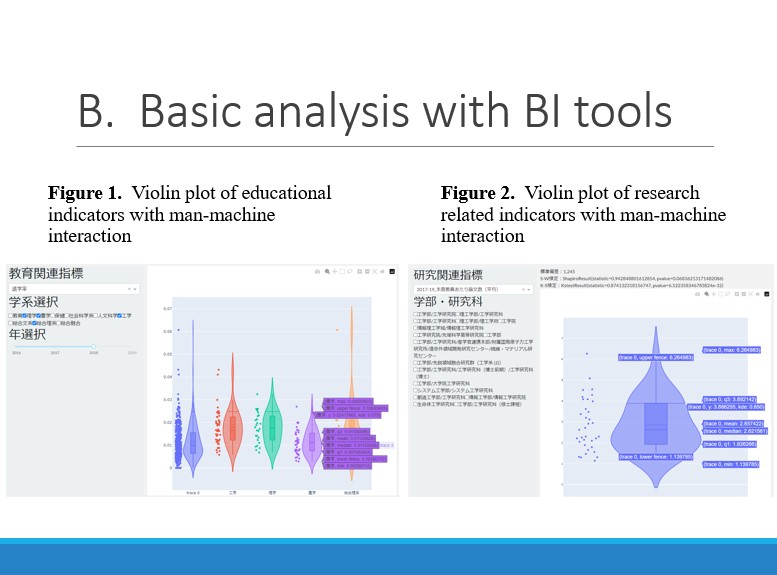
Figure 1 and 2 show our BI tools for basic financial analysis
for the features of education or research indicators of Japanese university by Box plot or Violin plot.
Left side panels in these figures provide selection functions for some ordinal indicators, academic fields or fiscal years.
Figure 2 also provides the result of Normality Test (Shapiro–Wilk test) in upper side of the figure.
These interactive visualization tools provide the BI functions of such as filtering and drill-down with agile reaction of user-interface.
|
 IEEE/ICACT20230139 Slide.07
[Big Slide]
IEEE/ICACT20230139 Slide.07
[Big Slide]