 |
As a next stage of financial analysis, we examine from the points of Correlation Analysis.
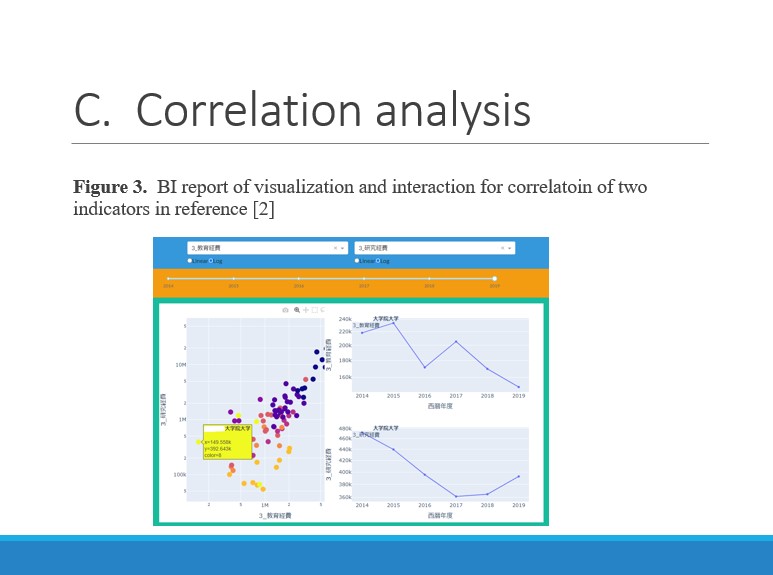
Figure 3 shows our supporting tool for correlation analysis by using visualization and interaction of two financial statement data in [2].
The figure is an example of visualization and interaction report of PL statement with comparing two accounting items.
In the left side, pointing or mouse over the university point in scatter plot generates a popup modal window of detailed information,
and time series charts of the selected two financial items in right side.
|
 IEEE/ICACT20230139 Slide.08
[Big Slide]
IEEE/ICACT20230139 Slide.08
[Big Slide]