 IEEE/ICACT20230139 Slide.09
[Big Slide]
Oral Presentation
IEEE/ICACT20230139 Slide.09
[Big Slide]
Oral Presentation 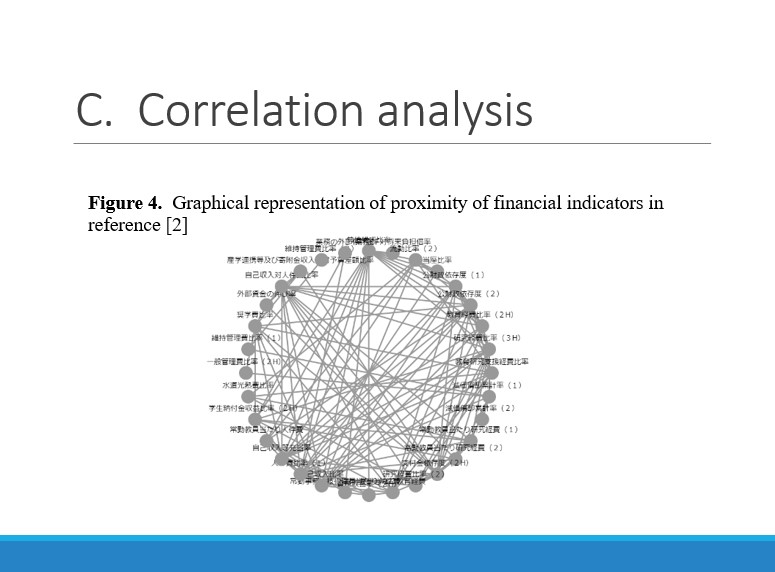
| Virual Oral Presentation Slide by Slide |
|
IEEE/ICACT20230139 Slide.09
[Big Slide]
| Oral Presentation |
|
|
|
We can also consider Correlation Matrix with Heat Map and so on. Figure 4 shows Graphical Representation of indicator correlation which expresses the proximity of financial indicators in terms of correlation or partial-correlation in [2]. Moreover, in order to express the proximity for supporting indicator selection, we also applied Graphical Lasso method for the covariance matrix of our financial indicators. | |
| [Go to Next Slide] |