 IEEE/ICACT20230234 Slide.12
[Big Slide]
Oral Presentation
IEEE/ICACT20230234 Slide.12
[Big Slide]
Oral Presentation 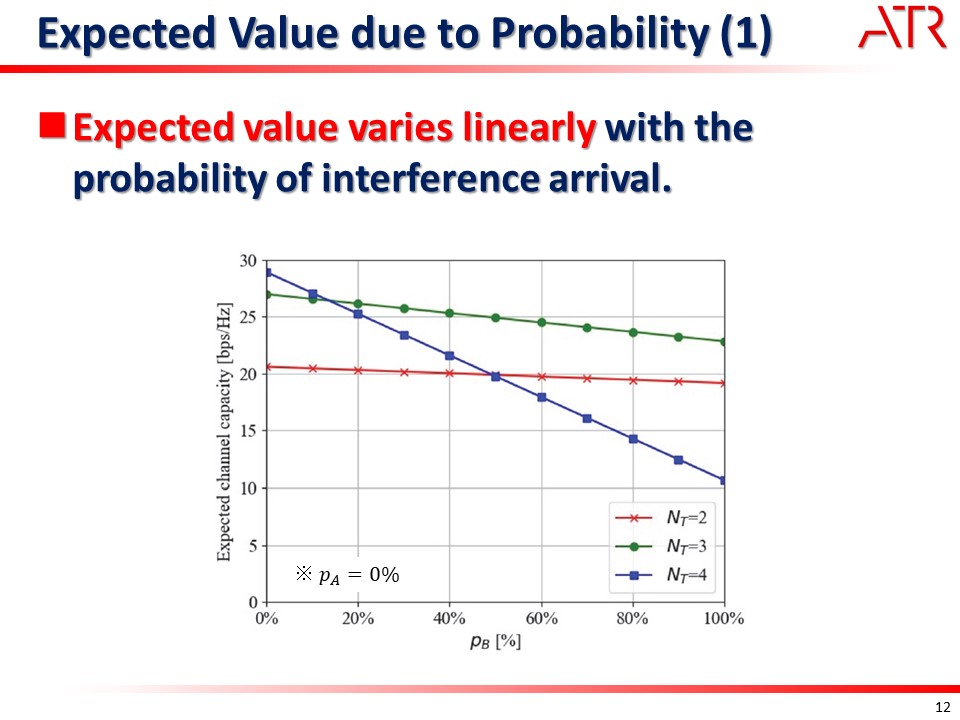
| Virual Oral Presentation Slide by Slide |
|
IEEE/ICACT20230234 Slide.12
[Big Slide]
| Oral Presentation |
|
|
|
Next, we show the change in expected value with the different the probability of arrival of interference. In this figure, the probability of arrival of interference A is 0%, meaning it is the result of a single interference. You can see that the expected value varies linearly with the probability of arrival of the interference.ˇˇWhen the probability is 100%, rank 3 is optimal, which indicates the degree of freedom to suppress a single interference wave. | |
| [Go to Next Slide] |