 IEEE/ICACT20230270 Slide.13
[Big Slide]
Oral Presentation
IEEE/ICACT20230270 Slide.13
[Big Slide]
Oral Presentation 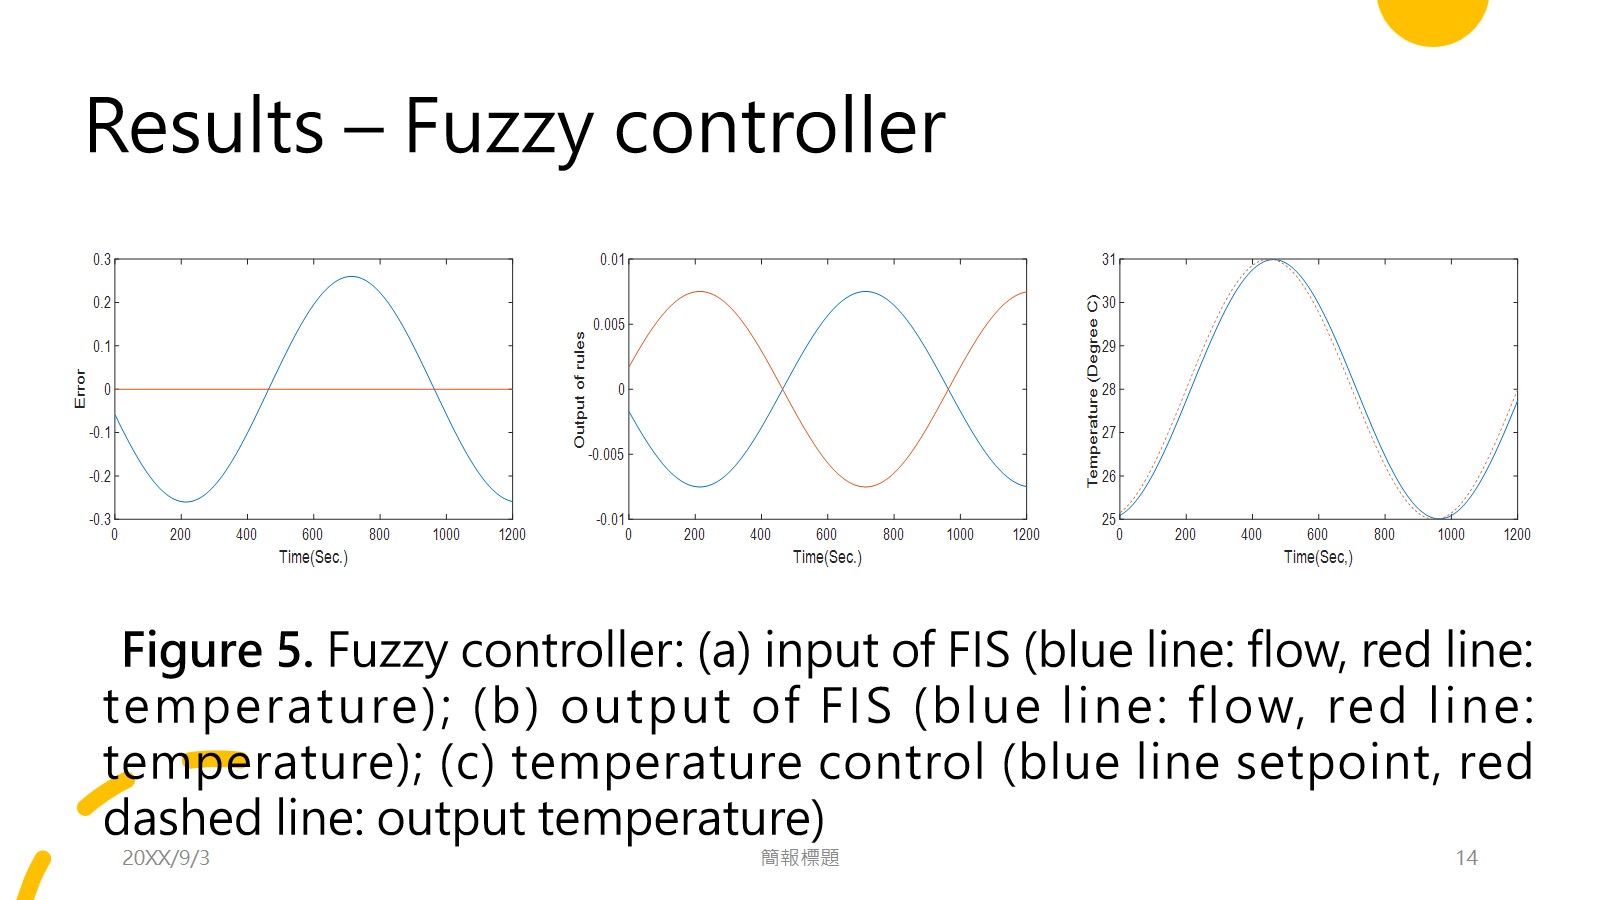
| Virual Oral Presentation Slide by Slide |
|
IEEE/ICACT20230270 Slide.13
[Big Slide]
| Oral Presentation |
|
|
|
A. Fuzzy control The controlled temperature of the fuzzy controller was presented in Fig. 5. In (a), the inputs (errors) of FIS were displayed. The blue line was flow and the red line was temperature. The output of FIS was presented in (b) where the blue line was flow and the red line was temperature. In (c), the controlled temperature was displayed in (c). the response needed to improve because of 25-second delay. | |
| [Go to Next Slide] |