 |
So we moving on to benchmarking data recap and visualization.
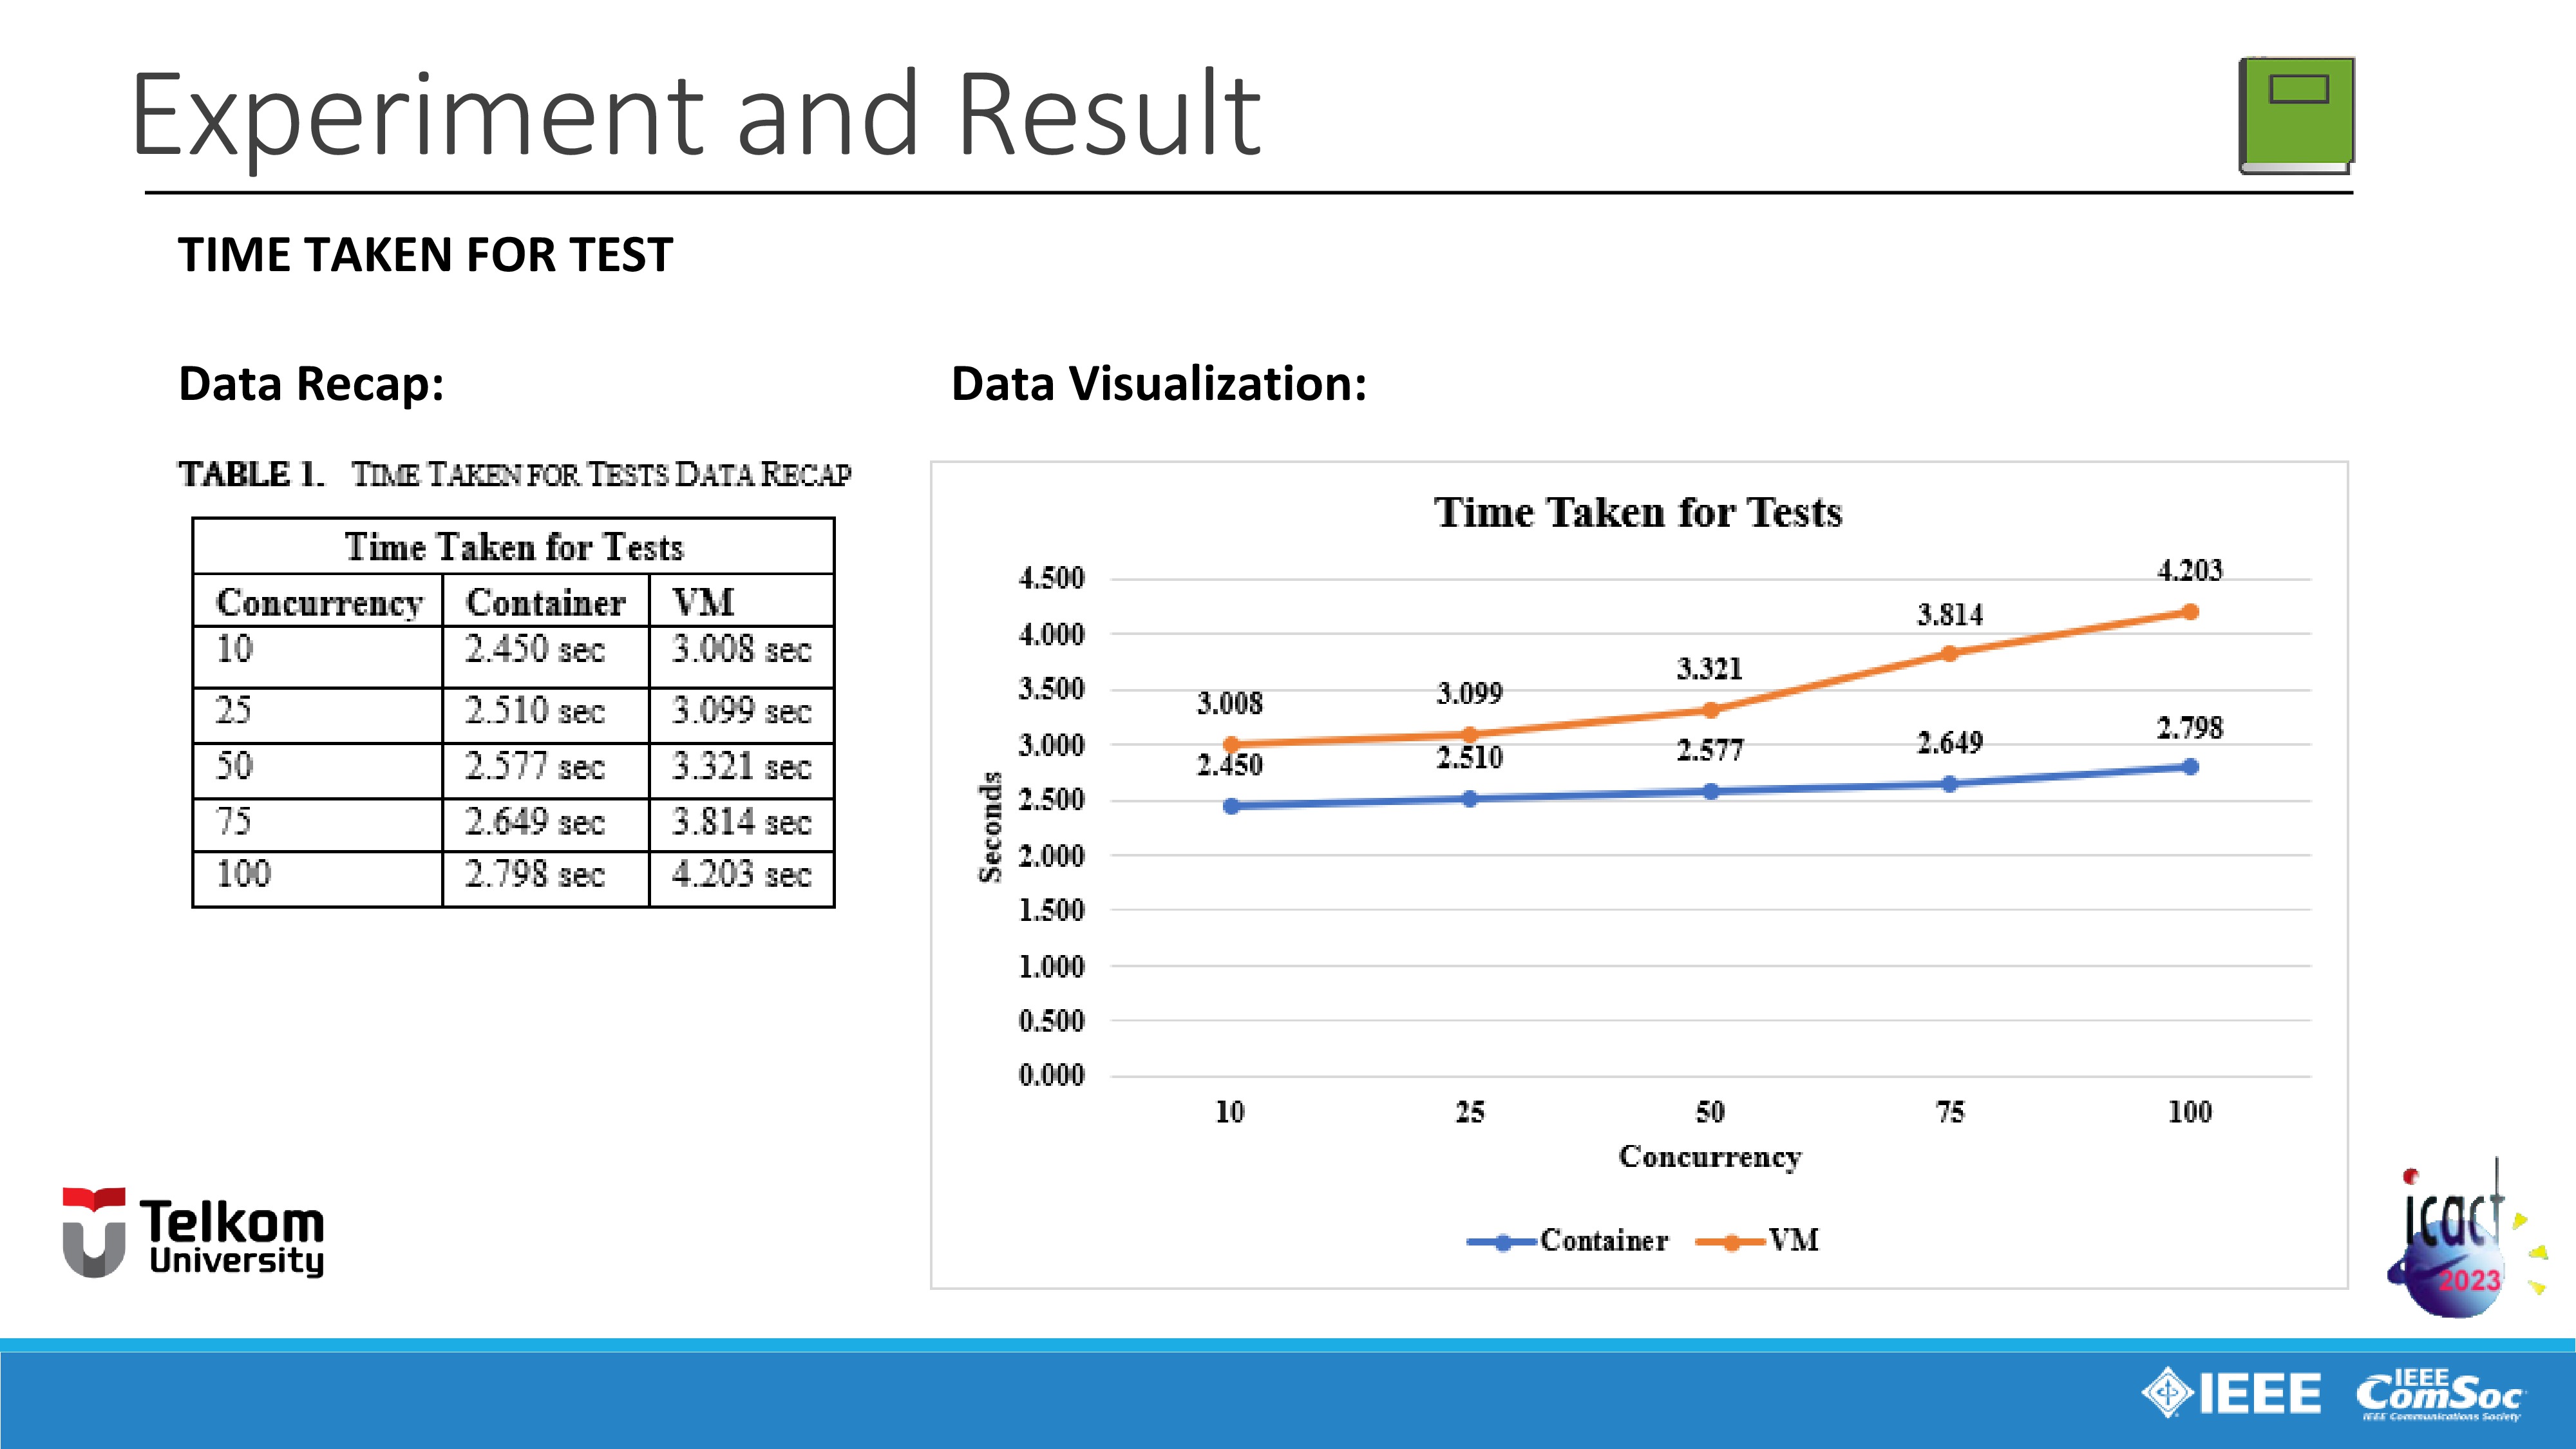
First is for the variable time taken for one session of benchmarking test.
As we can see in the data recap and visualization, VM virtualization marked in orange line is taking more time for one session of benchmarking test than container virtualization, marked in blue line. The VM virtualization takes in span of three until four seconds to complete the test meanwhile the container virtualization is taking less time than VM in just span of two seconds.
And also we can see that, the greater the concurrency, the longer it takes to complete the test session.
For example, using the ten concurrency parameter, VM needs three point eight seconds to complete the test, and then for twenty five concurrency parameter, the time needed is increasing to three point ninenty nine seconds, and its and continues to increase constantly for fifty concurrency, seventy-five concurrency, and finally in one hundred concurrency parameters the VM needs four point two hundred and three seconds. And the same thing is also happened to container virtualization, the time required increases as concurrency increases too.
This happens because the greater the concurrency, the more memory is needed for the test session, that means the greater the concurrency, the more time it takes to complete the test session. |
 IEEE/ICACT20230068 Slide.20
[Big Slide]
[YouTube]
IEEE/ICACT20230068 Slide.20
[Big Slide]
[YouTube]