 IEEE/ICACT20230139 Slide.20
[Big Slide]
Oral Presentation
IEEE/ICACT20230139 Slide.20
[Big Slide]
Oral Presentation 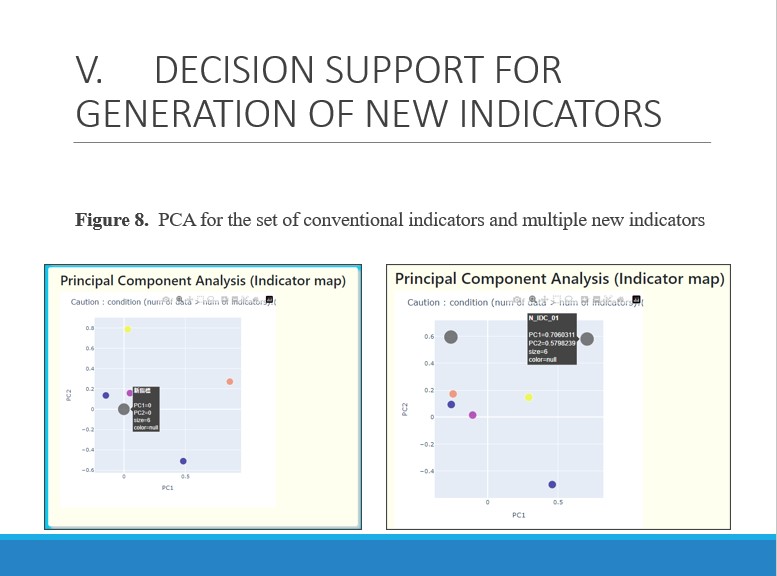
| Virual Oral Presentation Slide by Slide |
|
IEEE/ICACT20230139 Slide.20
[Big Slide]
| Oral Presentation |
|
|
|
Left of Figure 8 shows an initial scatter plot of indicators and newly generated two indicators. Right of Figure 8 shows the indicator generation as a result of PCA with the combination of the existing indicators and the newly generated two indicators. In the figure, each color represents the conventional five categories of financial indicators. | |
| [Go to Next Slide] |