 IEEE/ICACT20230139 Slide.22
[Big Slide]
Oral Presentation
IEEE/ICACT20230139 Slide.22
[Big Slide]
Oral Presentation 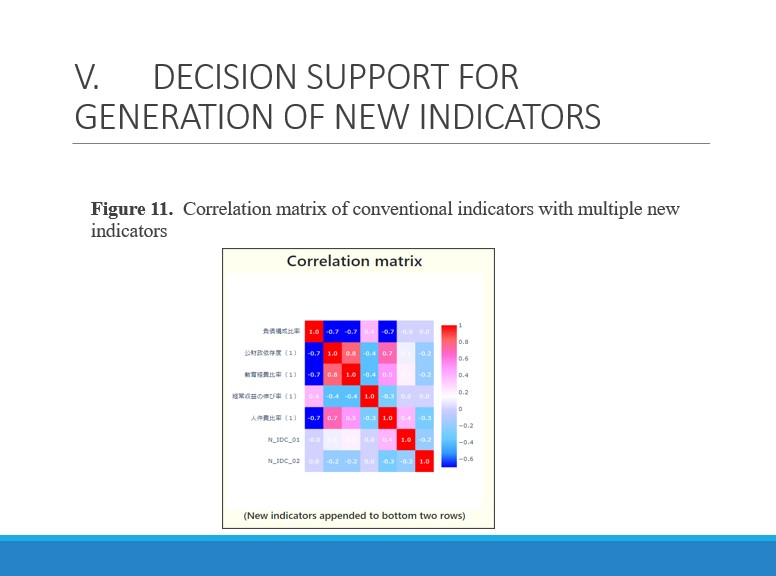
| Virual Oral Presentation Slide by Slide |
|
IEEE/ICACT20230139 Slide.22
[Big Slide]
| Oral Presentation |
|
|
|
Figure 11 shows correlation matrix of conventional indicators with new indicator. The results will change depending on Selection of existing indicators, Fiscal year, University scale, Aria (district) selection. By using the information of plots and the variation of scattering, user of this supporting system can understand the influence of adding the new indicators. | |
| [Go to Next Slide] |