 |
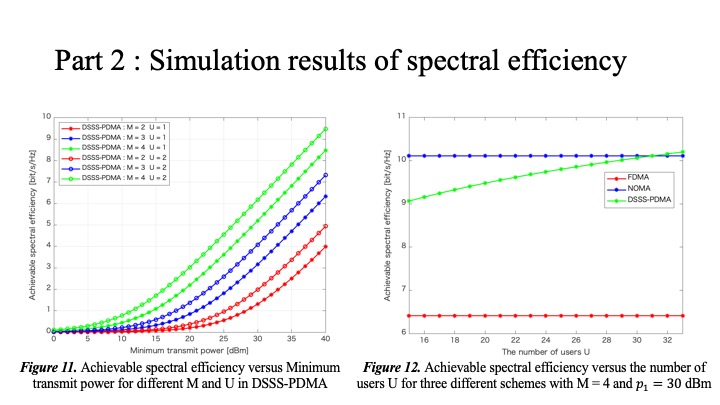
Figure. 11 shows the spectral efficiency when the number of power levels M and the number of user U for each power level are increased. It can be seen that the spectral efficiency when M is increased is larger than that when U is increased. Figure. 12 shows the spectral efficiency of FDMA, NOMA, and DSSS-PDMA schemes when U is increased from fifteen to thirty-three, derived from the length of the gold sequences. Since the power level M is fixed, the spectral efficiency of FDMA and NOMA with increasing number of sub-bands does not change. In contrast, the DSSS-PDMA scheme multiplexes the signals in the same bandwidth, so the spectral efficiency increases. In particular, it is greater than the NOMA scheme when U is larger than thirty-one.
|
 IEEE/ICACT20220184 Slide.24
[Big Slide]
 Oral Presentation
 IEEE/ICACT20220184 Slide.24
[Big Slide]
 Oral Presentation