ICACT20230139 Slide.25
[Big slide for presentation]
[YouTube]
ICACT20230139 Slide.25
[Big slide for presentation]
[YouTube] |
Chrome Text-to-Speach Click!! Click!! |
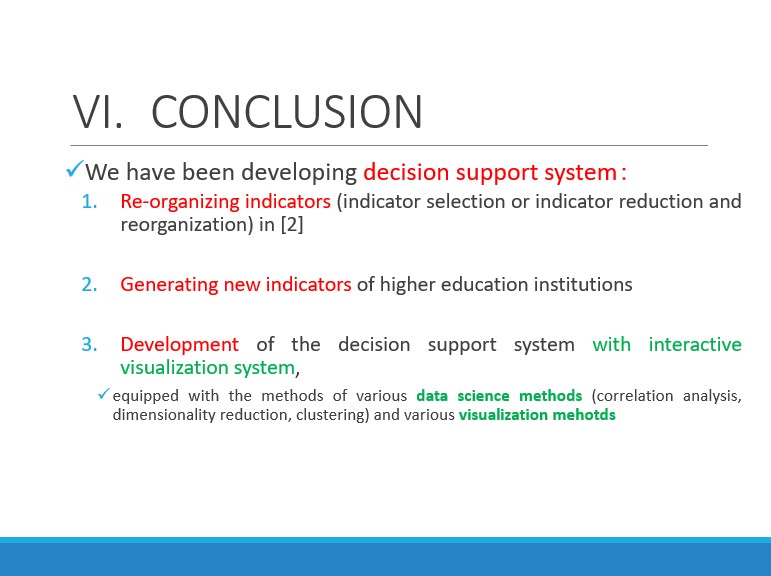 |
We have been developing decision support system to re-organize indicators in [2].
As a continuation from the system development,
in this paper, we examined decision support system for generating new financial indicators of higher education institutions,
and describe the development of the decision support system with interactive visualization system,
which is equipped with the methods of various data science methods of correlation analysis, dimensionality reduction, clustering and various visualization methods.
In order to expand to more comprehensive data analysis with comprehensive information of education and research activities of universities or non-profit organization,
it will become more important that the decision support system should be equipped with various functions of considering various viewpoints.
|
|
ICACT20230139 Slide.23
[Big slide for presentation]
|
Chrome Text-to-Speach Click!! |
 |
Our developing system will contribute to deepen the user’s understanding with Man-machine interaction.
In addition to this we can utilize our decision support system as follows.
|
|
ICACT20230139 Slide.22
[Big slide for presentation]
|
Chrome Text-to-Speach Click!! |
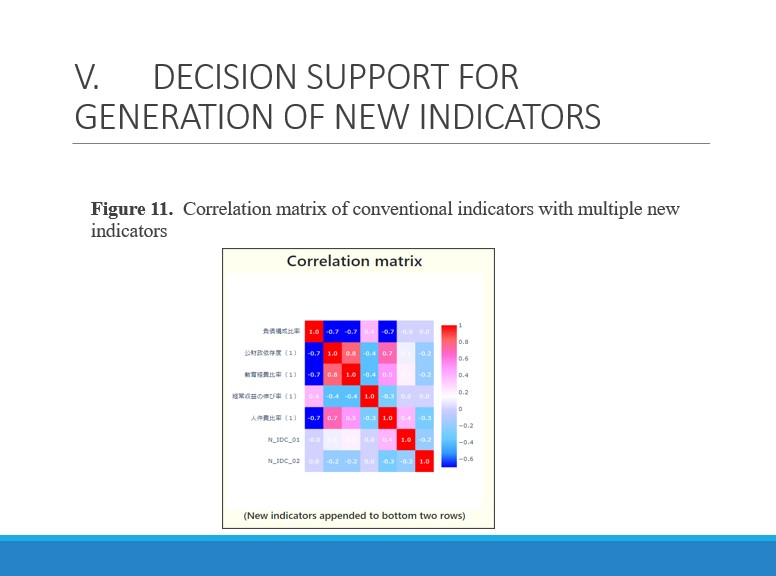 |
Figure 11 shows correlation matrix of conventional indicators with new indicator.
The results will change depending on
Selection of existing indicators,
Fiscal year,
University scale,
Aria (district) selection.
By using the information of plots and the variation of scattering,
user of this supporting system can understand the influence of adding the new indicators.
|
|
ICACT20230139 Slide.21
[Big slide for presentation]
|
Chrome Text-to-Speach Click!! |
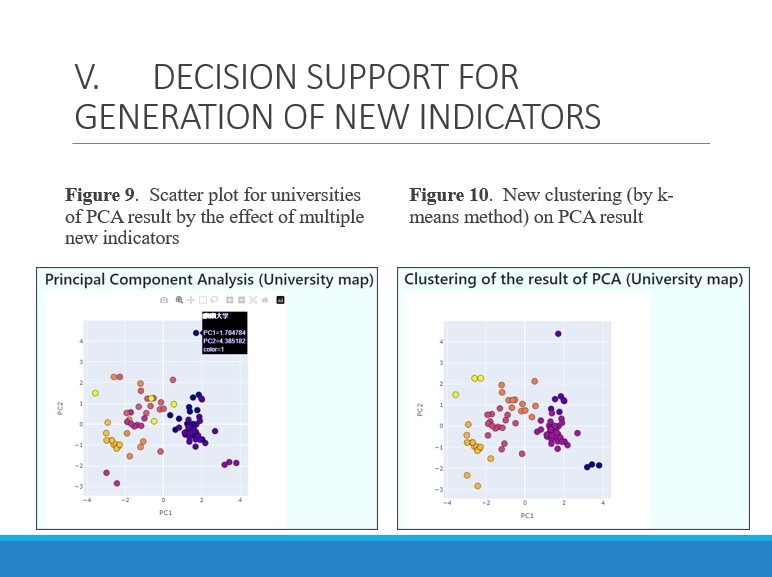 |
Figure 9 is a scatter plot of universities of the result of PCA.
In the figure, each color represents the conventional class of universities.
The tendency of the allocation of points is similar by other dimension reduction methods such as Isomap.
We execute some kinds of clustering methods (k-means and so on) on the dimension reduction space and visualize the clustering results.
Figure 10 shows the results of clustering (k-means) for the university scatter plot of Figure 9.
Different colors in the figure represent different clusters. The number of clusters can be varied depending on the situation.
|
|
ICACT20230139 Slide.20
[Big slide for presentation]
|
Chrome Text-to-Speach Click!! |
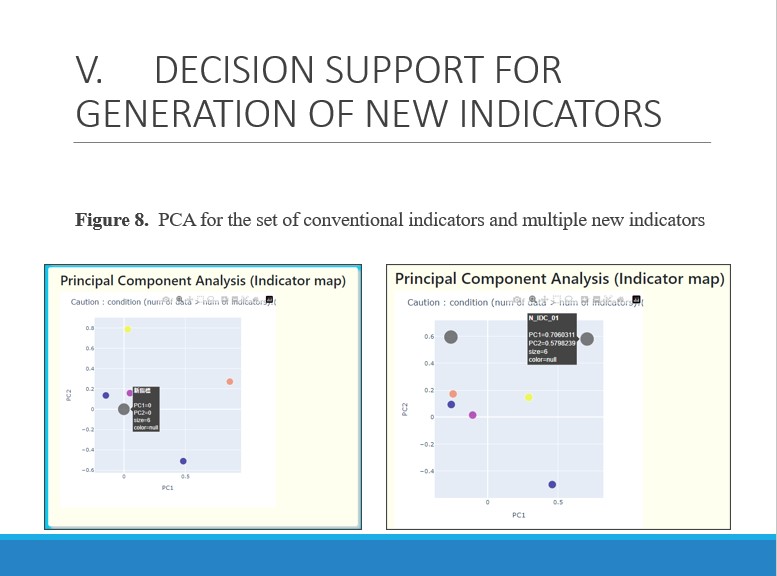 |
Left of Figure 8 shows an initial scatter plot of indicators and newly generated two indicators.
Right of Figure 8 shows the indicator generation as a result of PCA with the combination of the existing indicators and the newly generated two indicators.
In the figure, each color represents the conventional five categories of financial indicators.
|
|
ICACT20230139 Slide.19
[Big slide for presentation]
|
Chrome Text-to-Speach Click!! |
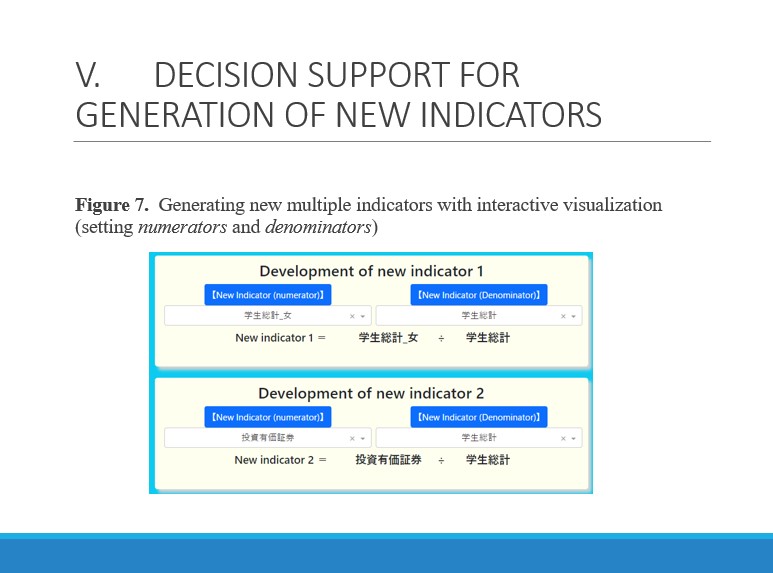 |
Figure 7 shows multiple indicator setting panels of numerators and denominators for multiple new indicators.
As an example, upper part of this figure shows the ratio of the number of female students to the number of whole students of universities.
|
|
ICACT20230139 Slide.18
[Big slide for presentation]
|
Chrome Text-to-Speach Click!! |
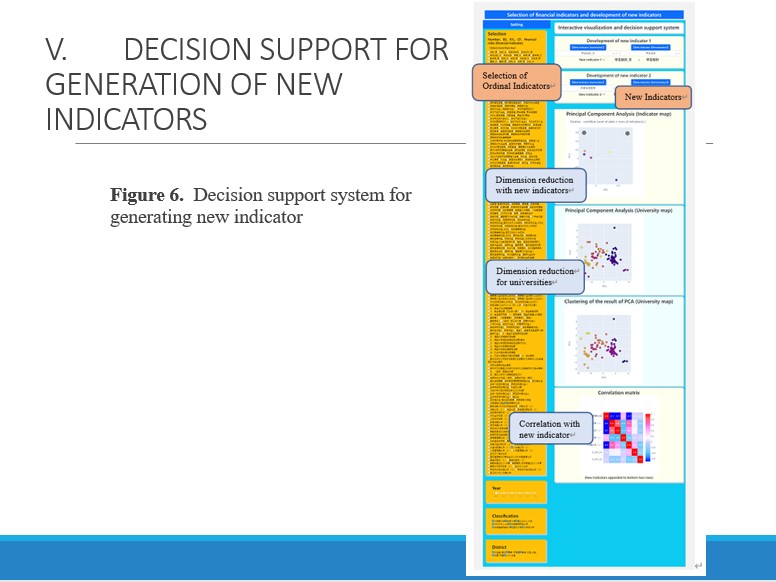 |
In our initial system development stage, as a new financial indicator structure, we assume simple financial ratio.
For example, we set a certain financial statement item of BS as numerator,
and set a certain basic item (e.g., number of students, number of teachers, number of staff, etc.) as denominator.
Figure 6 show the whole screen structure of our developing decision support system for new indicator development.
Left side panel shows the selection panel of ordinal indicators.
|
|
ICACT20230139 Slide.17
[Big slide for presentation]
|
Chrome Text-to-Speach Click!! |
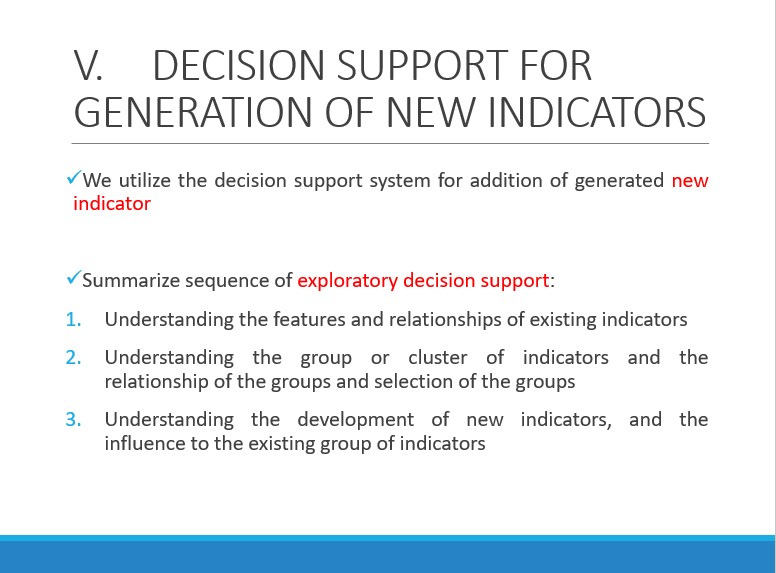 |
In this section, as a continuation from the system development described in previous section,
we examined decision support system for the Generation of New Indicators.
As mentioned in previous section, we have developed some support system for exploratory selection of financial indicators.
However, indicator selection cannot adequately comprehend various characteristics of university clusters or groups.
In the near future it will be necessary to create new indicators in addition to the existing financial indicators.
Therefore, it is desired to construct a support system for searching and generating new indicators.
|
|
ICACT20230139 Slide.15
[Big slide for presentation]
|
Chrome Text-to-Speach Click!! |
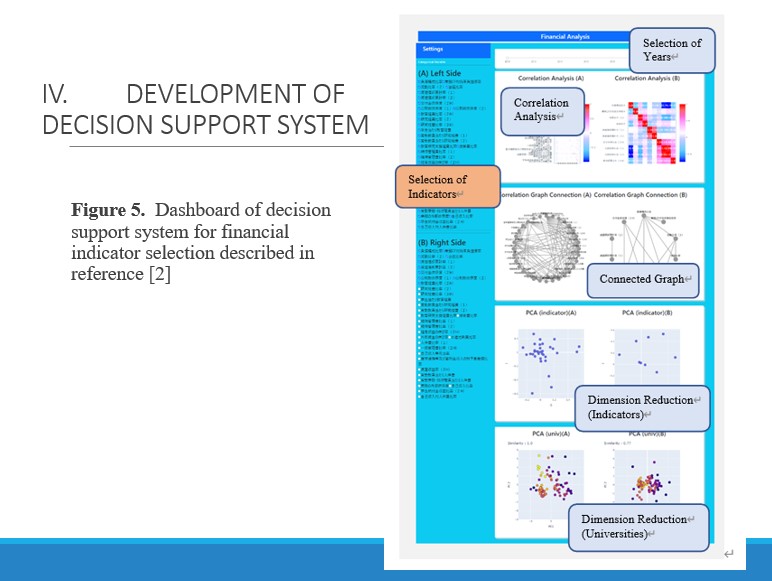 |
Figure 5 shows an example of our dashboard of decision support for indicator selection in [2].
Left side of the figure is the indicator selection panel of financial indicators for comparison of two situations of indicator selection.
Top side of the figure is the selection panel of fiscal year.
Right side consists of several data analysis reports.
We explain from top to bottom: Correlation analysis with Heat maps, correlation analysis by Connecting Graphs, dimension reduction for indicators by Principal Component Analysis (PCA), dimension reduction for universities by PCA with similarity degree.
These analysis reports show more detailed information by mouse-hover operation. All these reports are connected to indicator selection and year selection. Change of the result are responded instantly.
Two analysis results (Left and Right in the figure) are provided as comparison to the user or experts of this field while repeating trial and error (exploratory way). Consequently, they can reach the final decision of financial indicator selection.
|
|
ICACT20230139 Slide.14
[Big slide for presentation]
|
Chrome Text-to-Speach Click!! |
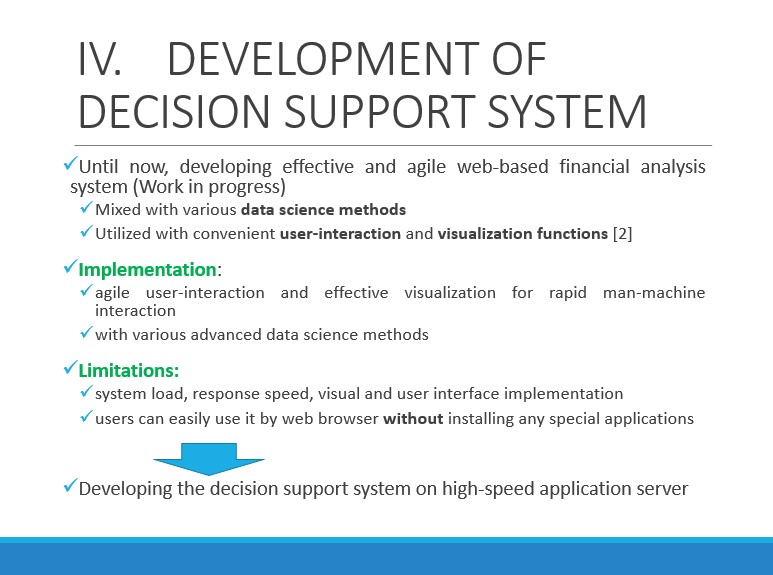 |
In this section, we introduce the development of our system as described in reference [2] as follows.
Implementing the functions of agile user-interaction and effective visualization is crucial
for the rapid man-machine interaction with various advanced data science methods.
However, practically there exit various limitations to realize advanced data science technique, e.g., limitation concerning system load, response speed, visual and user interface implementation. it is preferable that many users can easily use it by web browser without installing any special applications.
For practically realizing the decision-making procedure, we are developing the decision support system on high-speed application server with data analysis Python packages.
We have implemented some interactive tools on the server.
The system can rapidly response to the request and provide enough interaction and visualization functions.
|
|
ICACT20230139 Slide.13
[Big slide for presentation]
|
Chrome Text-to-Speach Click!! |
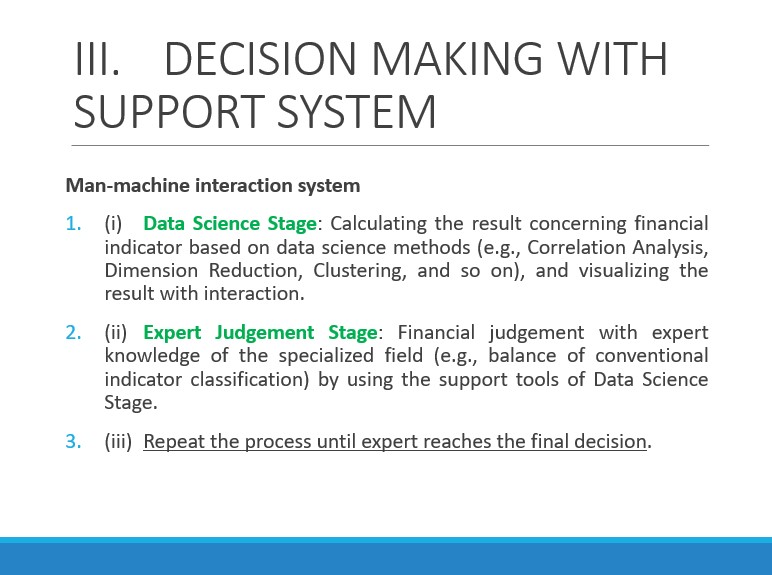 |
We are developing the financial indicator analysis system that aims to deepen the understanding of data by experts in the financial field,
that is a kind of man-machine Interaction System in [2].
In this system, as recommendation functions, various data science methods are utilized, and are aimed to support the user’s understanding of data.
In our decision-making situation, since it is necessary to consider the knowledge of specialized field of university finance, our methodology should be involved with the expert judgment.
Therefore, for assisting the expert’s judgement process, support system provides some assistant functions or suggestions based on data science methods combined with data visualization system in [2].
|
|
ICACT20230139 Slide.12
[Big slide for presentation]
|
Chrome Text-to-Speach Click!! |
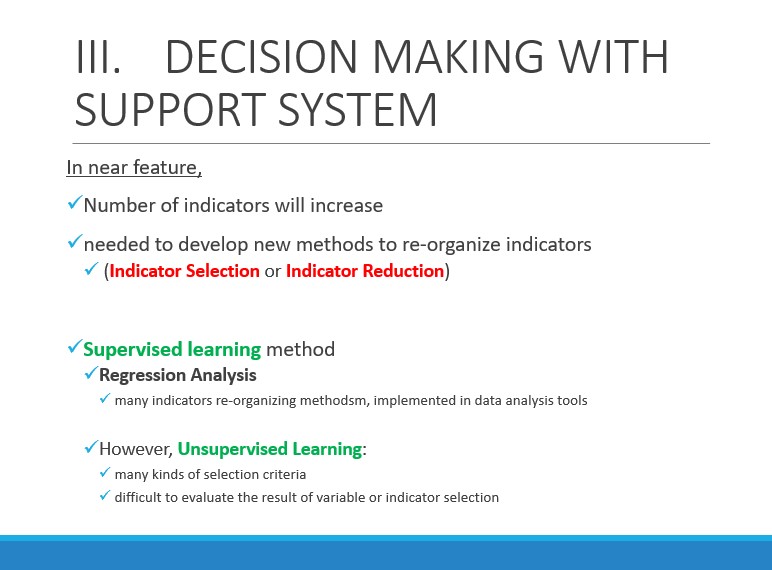 |
In near feature it is expected that the number of indicators to be examined will increase with new data to be considered.
The increase of the numbers of data and indicators is a general problem of big data analysis.
Therefore, it is needed to develop new methods to re-organize indicators
As a supervised learning method, in Multiple Regression Analysis,
many indicators re-organizing methods have been proposed, and implemented in data analysis tools.
However, our situation is a kind of Unsupervised Learning,
so that it has a problem that there are many kinds of selection criteria.
Therefore, it is difficult to evaluate the result of variable or indicator selection or re-organization.
|
|
ICACT20230139 Slide.10
[Big slide for presentation]
|
Chrome Text-to-Speach Click!! |
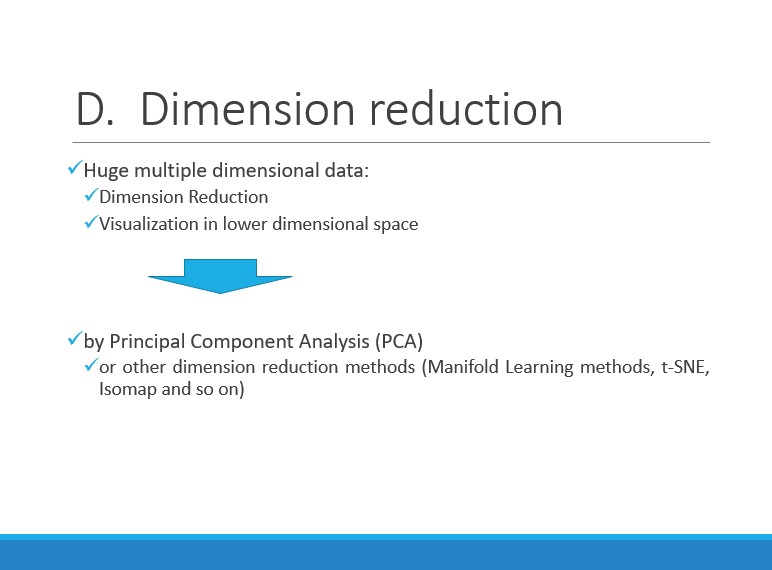 |
In the case of investigating huge multiple dimensional data of universities and financial indicators,
we should consider Dimension Reduction and Visualization in lower dimensional space
by utilizing Principal Component Analysis.
or other dimension reduction methods or Manifold Learning methods.
We have so far utilized these dimension reduction methods equipped in our supporting system.
Right side of Figure 5 shows the scatter chart of financial indicators in lower dimension by PCA in [2].
|
|
ICACT20230139 Slide.09
[Big slide for presentation]
|
Chrome Text-to-Speach Click!! |
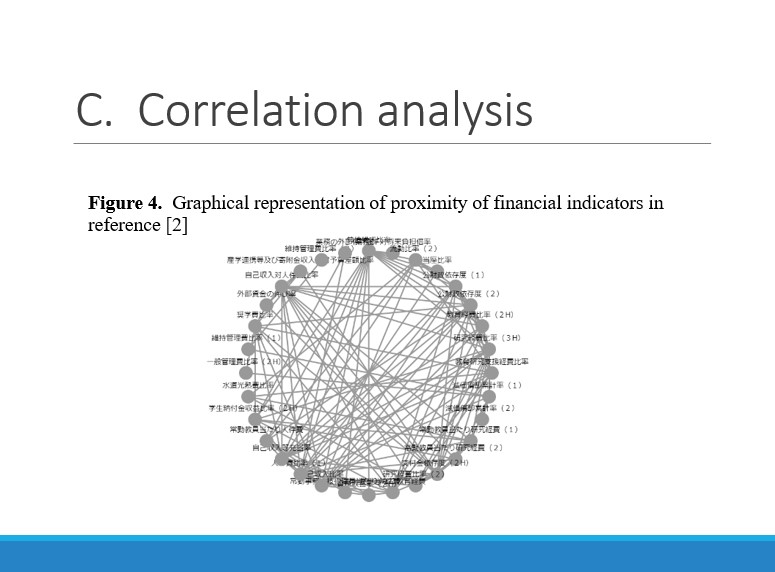 |
We can also consider Correlation Matrix with Heat Map and so on.
Figure 4 shows Graphical Representation of indicator correlation which expresses the proximity of financial indicators in terms of correlation or partial-correlation in [2].
Moreover, in order to express the proximity for supporting indicator selection,
we also applied Graphical Lasso method for the covariance matrix of our financial indicators.
|
|
ICACT20230139 Slide.08
[Big slide for presentation]
|
Chrome Text-to-Speach Click!! |
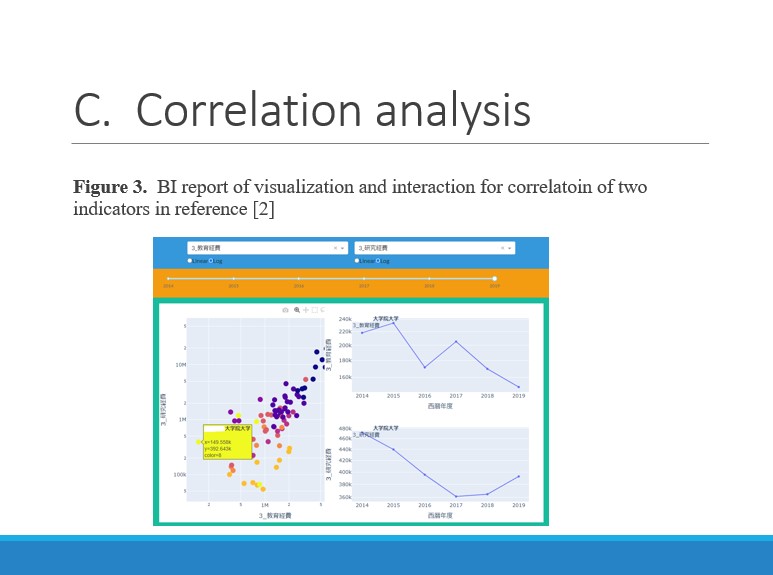 |
As a next stage of financial analysis, we examine from the points of Correlation Analysis.
Figure 3 shows our supporting tool for correlation analysis by using visualization and interaction of two financial statement data in [2].
The figure is an example of visualization and interaction report of PL statement with comparing two accounting items.
In the left side, pointing or mouse over the university point in scatter plot generates a popup modal window of detailed information,
and time series charts of the selected two financial items in right side.
|
|
ICACT20230139 Slide.07
[Big slide for presentation]
|
Chrome Text-to-Speach Click!! |
 |
Until now we have developed many BI tools. Adding to these developments,
we developed more easily operational web-based BI tools in reference 1 and 2.
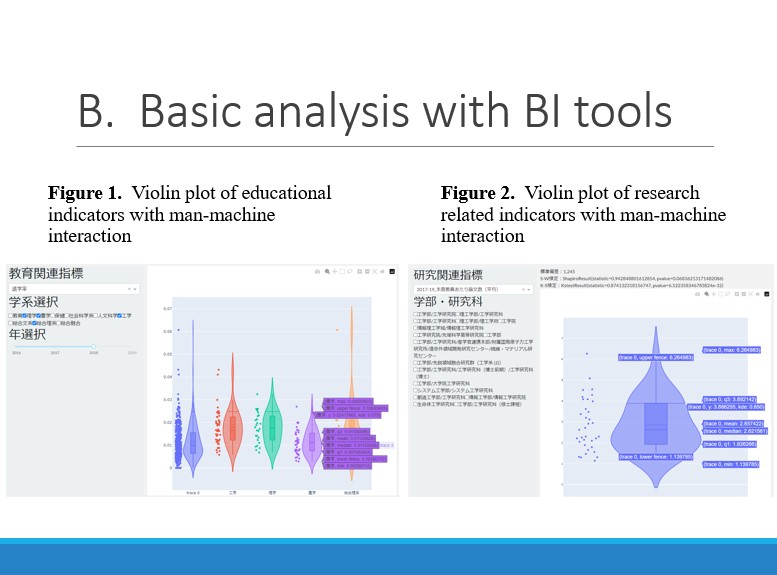
Figure 1 and 2 show our BI tools for basic financial analysis
for the features of education or research indicators of Japanese university by Box plot or Violin plot.
Left side panels in these figures provide selection functions for some ordinal indicators, academic fields or fiscal years.
Figure 2 also provides the result of Normality Test (Shapiro–Wilk test) in upper side of the figure.
These interactive visualization tools provide the BI functions of such as filtering and drill-down with agile reaction of user-interface.
|
|
ICACT20230139 Slide.06
[Big slide for presentation]
|
Chrome Text-to-Speach Click!! |
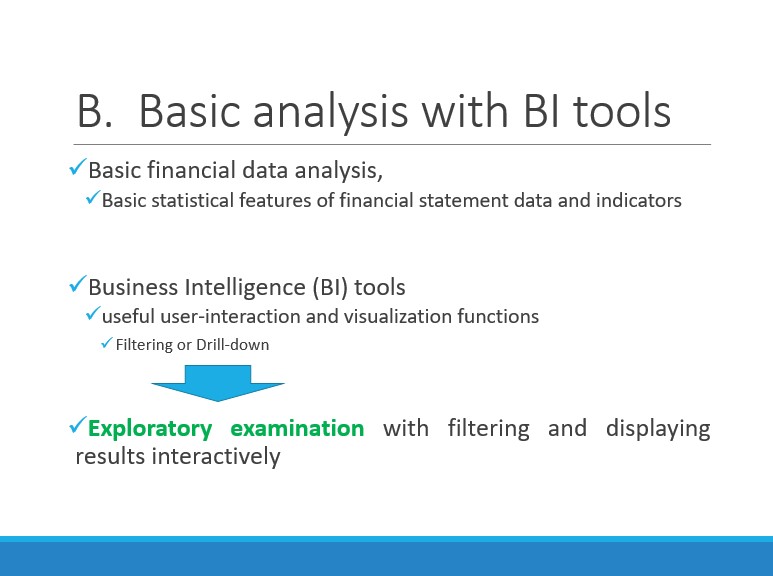 |
As a basic financial data analysis, we usually examine basic statistical features of financial statement data.
In recent years Business Intelligence tools have made progress and obtained commercial success.
Combining useful user-interaction and visualization functions,
BI tools play important and promising role of the basic data analysis.
BI tools effectively visualize the data charts, and moreover dynamically change many of them in conjunction
with user-interaction functions such as Filtering or Drill-down.
User can repeatedly operate exploratory examination with filtering and displaying results interactively.
|
|
ICACT20230139 Slide.05
[Big slide for presentation]
|
Chrome Text-to-Speach Click!! |
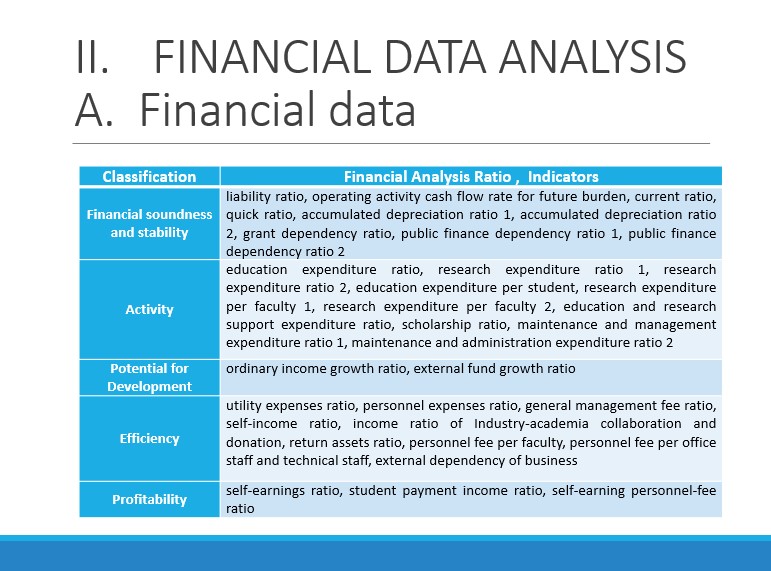 |
In much literature, conventional financial indicators or financial analysis ratio of Japanese universities have been categorized in five financial categories
such as “Financial soundness and stability”, “Activity”, “Development”, “Efficiency” and “Profitability”.
Dozens of financial indicators of universities are defined in these categories in reference 1 and 2.
|
|
ICACT20230139 Slide.03
[Big slide for presentation]
|
Chrome Text-to-Speach Click!! |
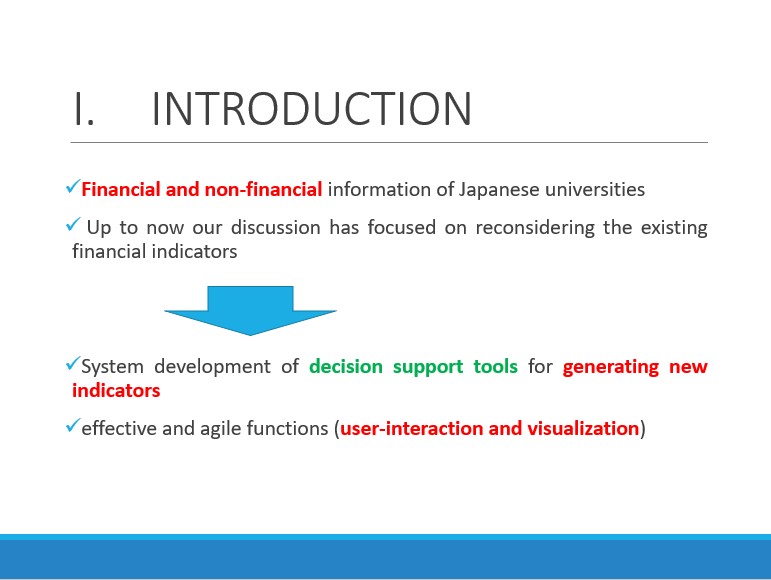 |
So far, we have examined the financial and non-financial information of Japanese universities
Up to now our discussion has focused on reconsidering the existing financial indicators
We have developed some data visualization tools with man-machine interaction in reference 1 and 2.
However, what will be more desired for sophisticated data analysis is a development of appropriate indicators combining with conventional indicators.
Therefore, system development for generating new indicators is expected.
As a consideration of system development, developments of effective and agile functions of user-interaction and visualization are crucial issues.
|
|
ICACT20230139 Slide.02
[Big slide for presentation]
|
Chrome Text-to-Speach Click!! |
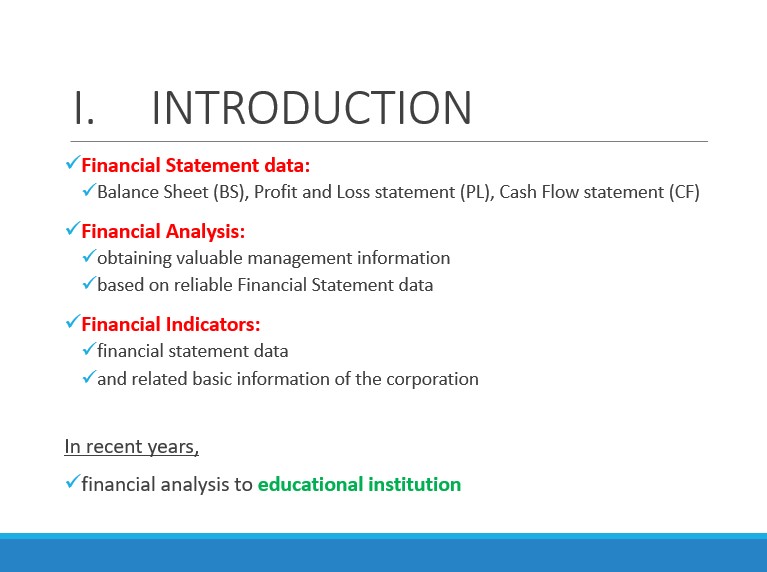 |
Financial Statement data consists of Balance Sheet Profit and Loss statement, Cash Flow statement and so on.
As a basis of corporate management, Financial Analysis is a method of obtaining valuable management information on the financial condition of corporation based on reliable Financial Statement data.
Every kind of Financial Indicators are constructed by combining these financial statement data and related basic information of the corporation.
In recent years, financial analysis is performed not limited to corporation or profit organization but also to educational institution.
Moreover, non-financial data, which are related to organizational structure, internal or external evaluation, organizational improvement, international and regional contribution are need to be investigated
|
|
ICACT20230139 Slide.01
[Big slide for presentation]
|
Chrome Text-to-Speach Click!! |
 |
Hi everybody, my name is Masaaki Ida. I would like to talk about development of indicator with interactive visualization system.
|
|
ICACT20230139 Slide.00
[Big slide for presentation]
[YouTube] |
Chrome Text-to-Speach Click!! |
 |
Development of Indicator with Interactive Visualization System
|