ICACT20230068 Slide.28
[Big slide for presentation]
[YouTube]
ICACT20230068 Slide.28
[Big slide for presentation]
[YouTube] |
Chrome Text-to-Speach Click!! Click!! |
 |
So that's it for my presentation. Thank You for Your Attention.
|
|
ICACT20230068 Slide.27
[Big slide for presentation]
[YouTube] |
Chrome Text-to-Speach Click!! |
 |
In future works, we hope to be able to implement this research more deeply in the ANGKASA project by using a more sophisticated set-up and tools that have more variables that can be analyzed so that we can get more optimal and in-depth analysis results.
|
|
ICACT20230068 Slide.26
[Big slide for presentation]
[YouTube] |
Chrome Text-to-Speach Click!! |
 |
So based on the experiment and the result shows that:
First point is, In terms of serving requests per second and its transfer rate of data, container virtualization has higher serving rate of requests per second and also has higher transfer rate of data which means is more effective than VM virtualization.
And in terms of time taken, container virtualization is taking less time to complete the tests, complete the request for each concurrency and complete the request for across all requests which means is also more effective than VM virtualization.
This happens because if we look back to the related works in the second part of this presentation outline and on the literatures about Virtualization technology as I explained before, unlike VM, container virtualization does not simulate a full operating system and only isolates applications with their dependencies called container. And According to Docker, a container is a lightweight, stand-alone, executable package of a piece of software that includes everything needed to run it. This means Docker containers are much smaller and require far fewer resources so that resource usage becomes more effective such as memory usage, CPU, network, and etc. unlike VM virtualization that fully simulates operating system into virtual machine and use more resources.
So the final conclusion we can take is container virtualization is better than full virtualization or VM virtualization in terms of serving requests for virtual e-learning system.
|
|
ICACT20230068 Slide.25
[Big slide for presentation]
[YouTube] |
Chrome Text-to-Speach Click!! |
 |
Next we moving on to the last part, Conclusion and Future Works.
|
|
ICACT20230068 Slide.24
[Big slide for presentation]
[YouTube] |
Chrome Text-to-Speach Click!! |
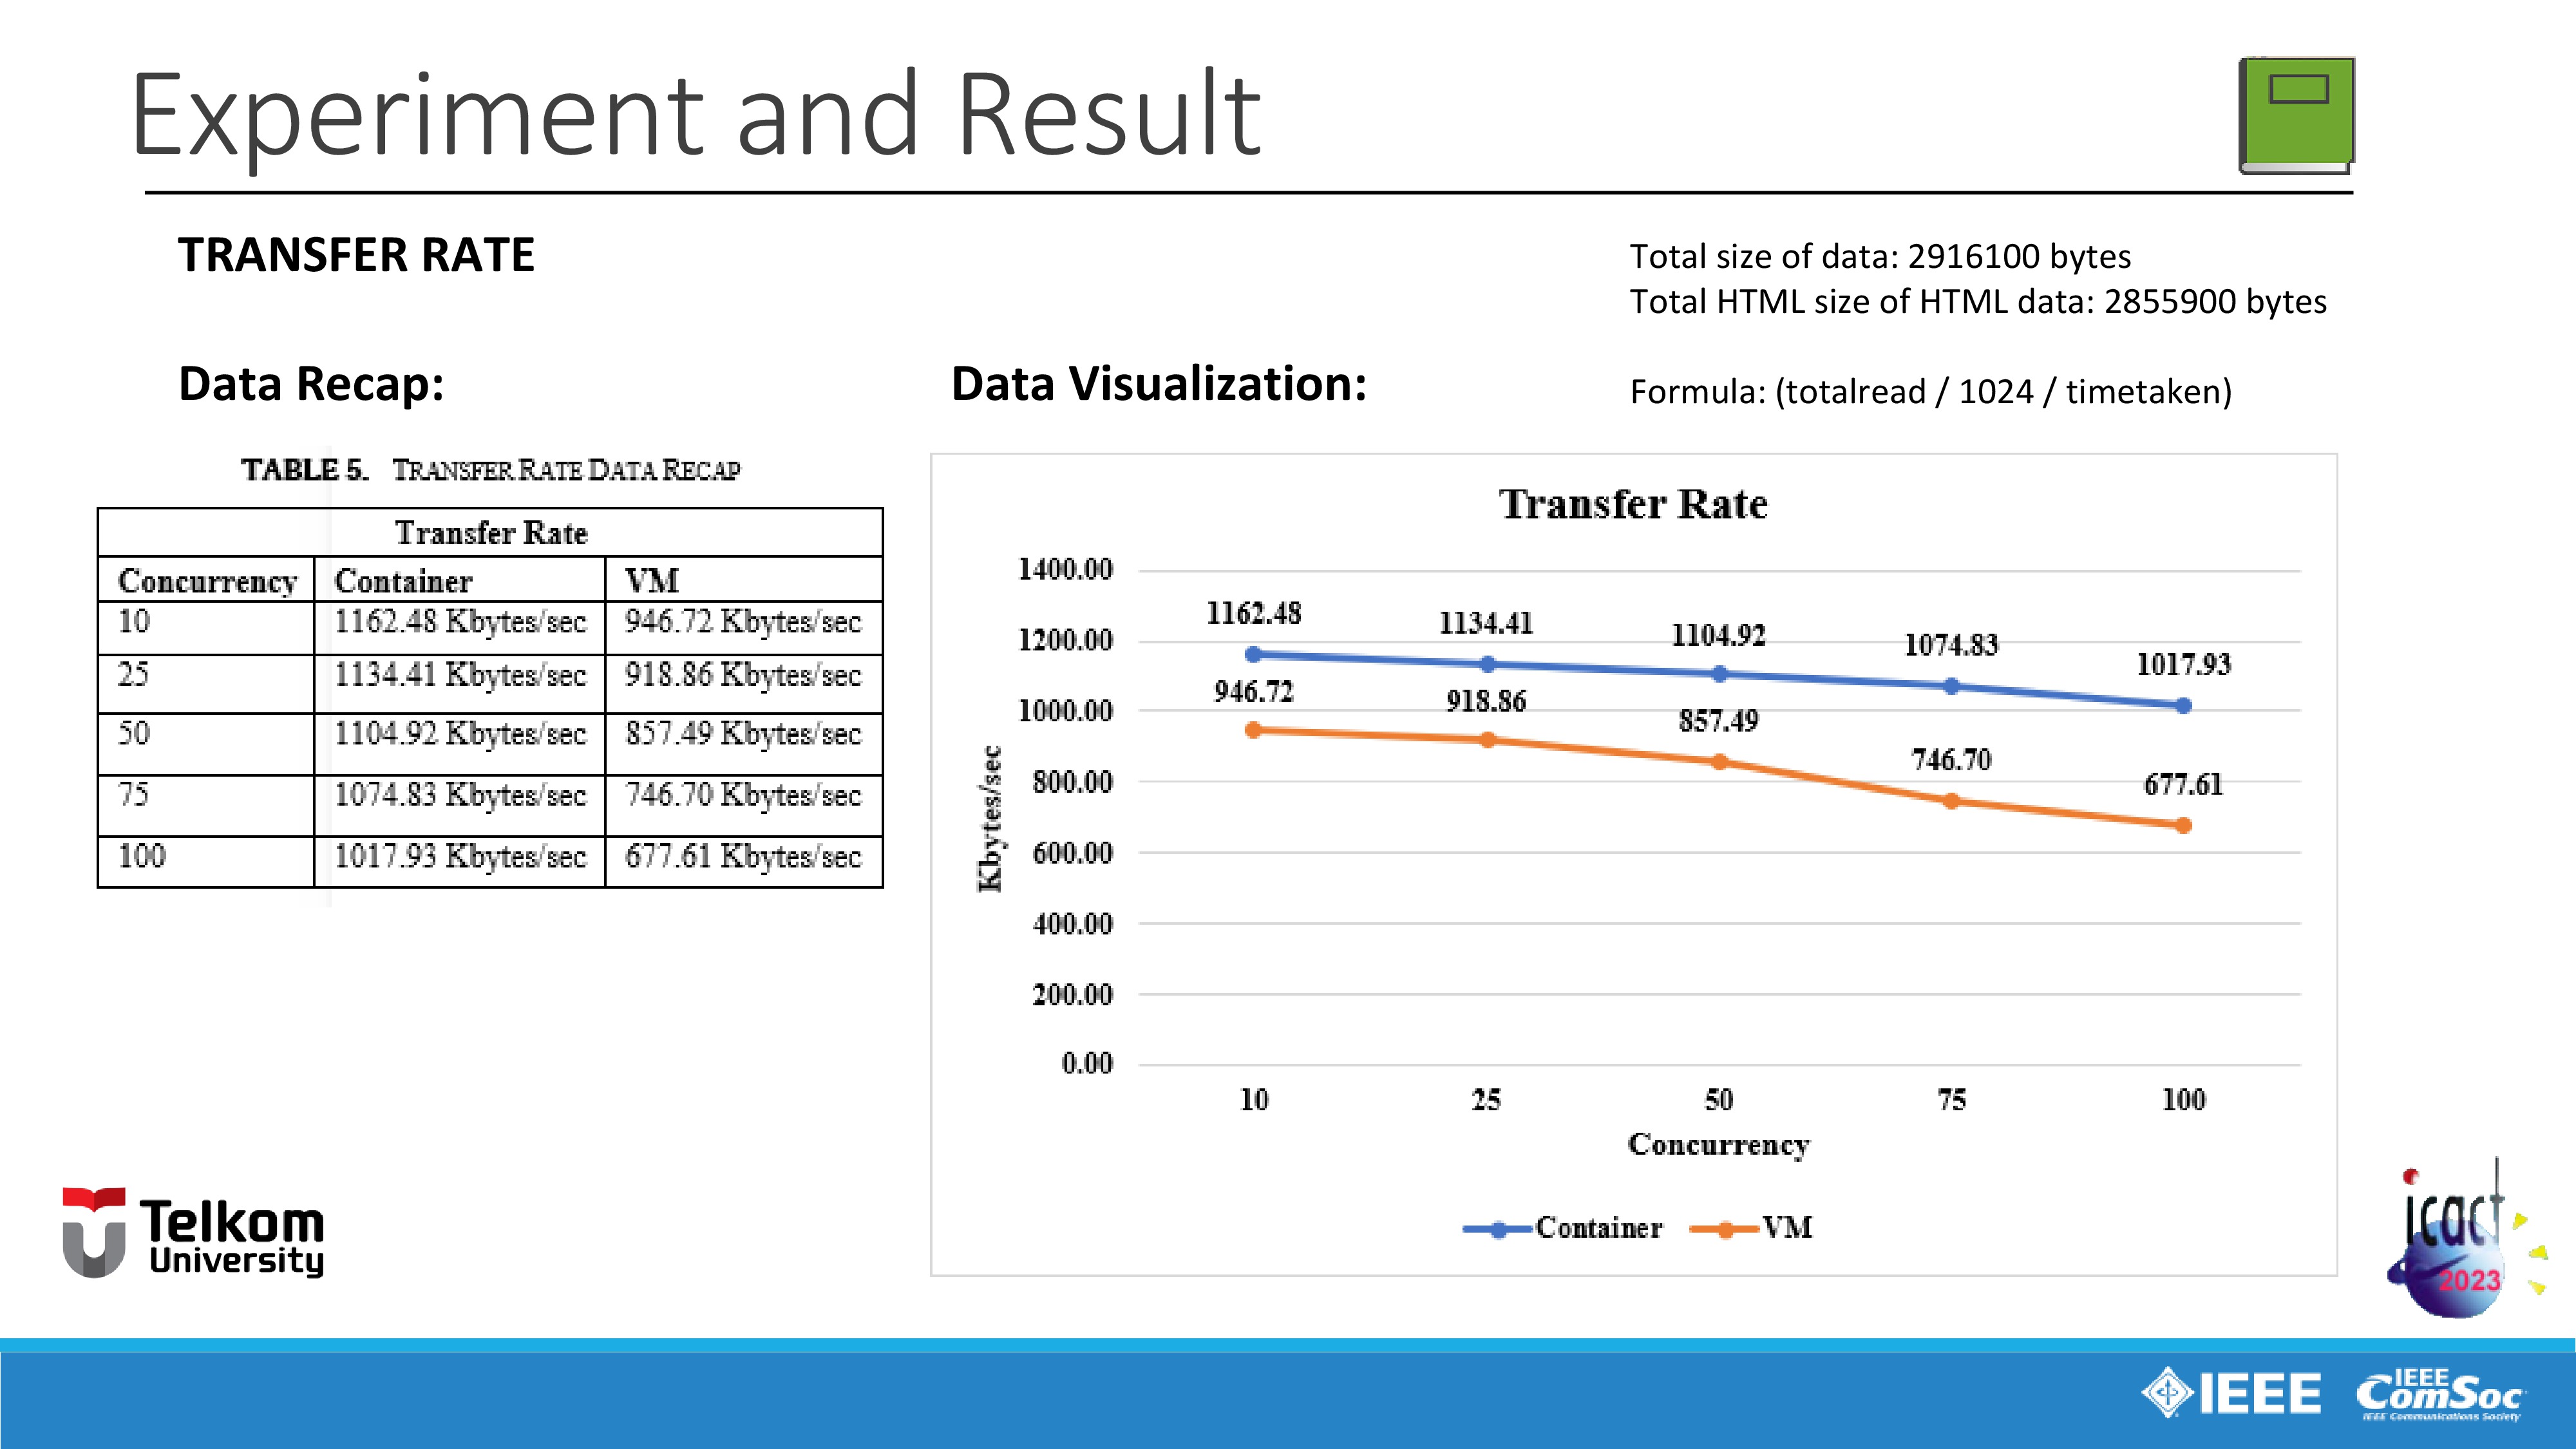 |
Last variable is Transfer rate of data with the total size of data transferred is 2916100 (two million nine hundred sixteen thousand one hundred) bytes and with total of 2855900 (two million eight hundred fifty-five thousand nine hundred) bytes of HTML data transferred.
According to the Apache official website, The data in this variable is calculated with formula: (total data read divided by one thousand twenty-four divided by time taken for test).
In this variable, container has higher transfer rate of data in span of one thousand one hundred sixty two point forty eight Kilobytes per second until one thousand seventeen point ninety three Kilobytes per second.
Meanwhile VM has lower transfer rate of data in span of nine hundred and forty six point seventy two Kilobytes per second until six hundred seventy seven point sixty one Kilobytes per second.
As we can see in this case, the greater the concurrency, the lower transfer rate of data for each concurrency has.
This happens because the greater the concurrency, then more queues of data is needed for the transferring process and so it also affects the transfer rate bandwidth for each concurrency.
|
|
ICACT20230068 Slide.23
[Big slide for presentation]
[YouTube] |
Chrome Text-to-Speach Click!! |
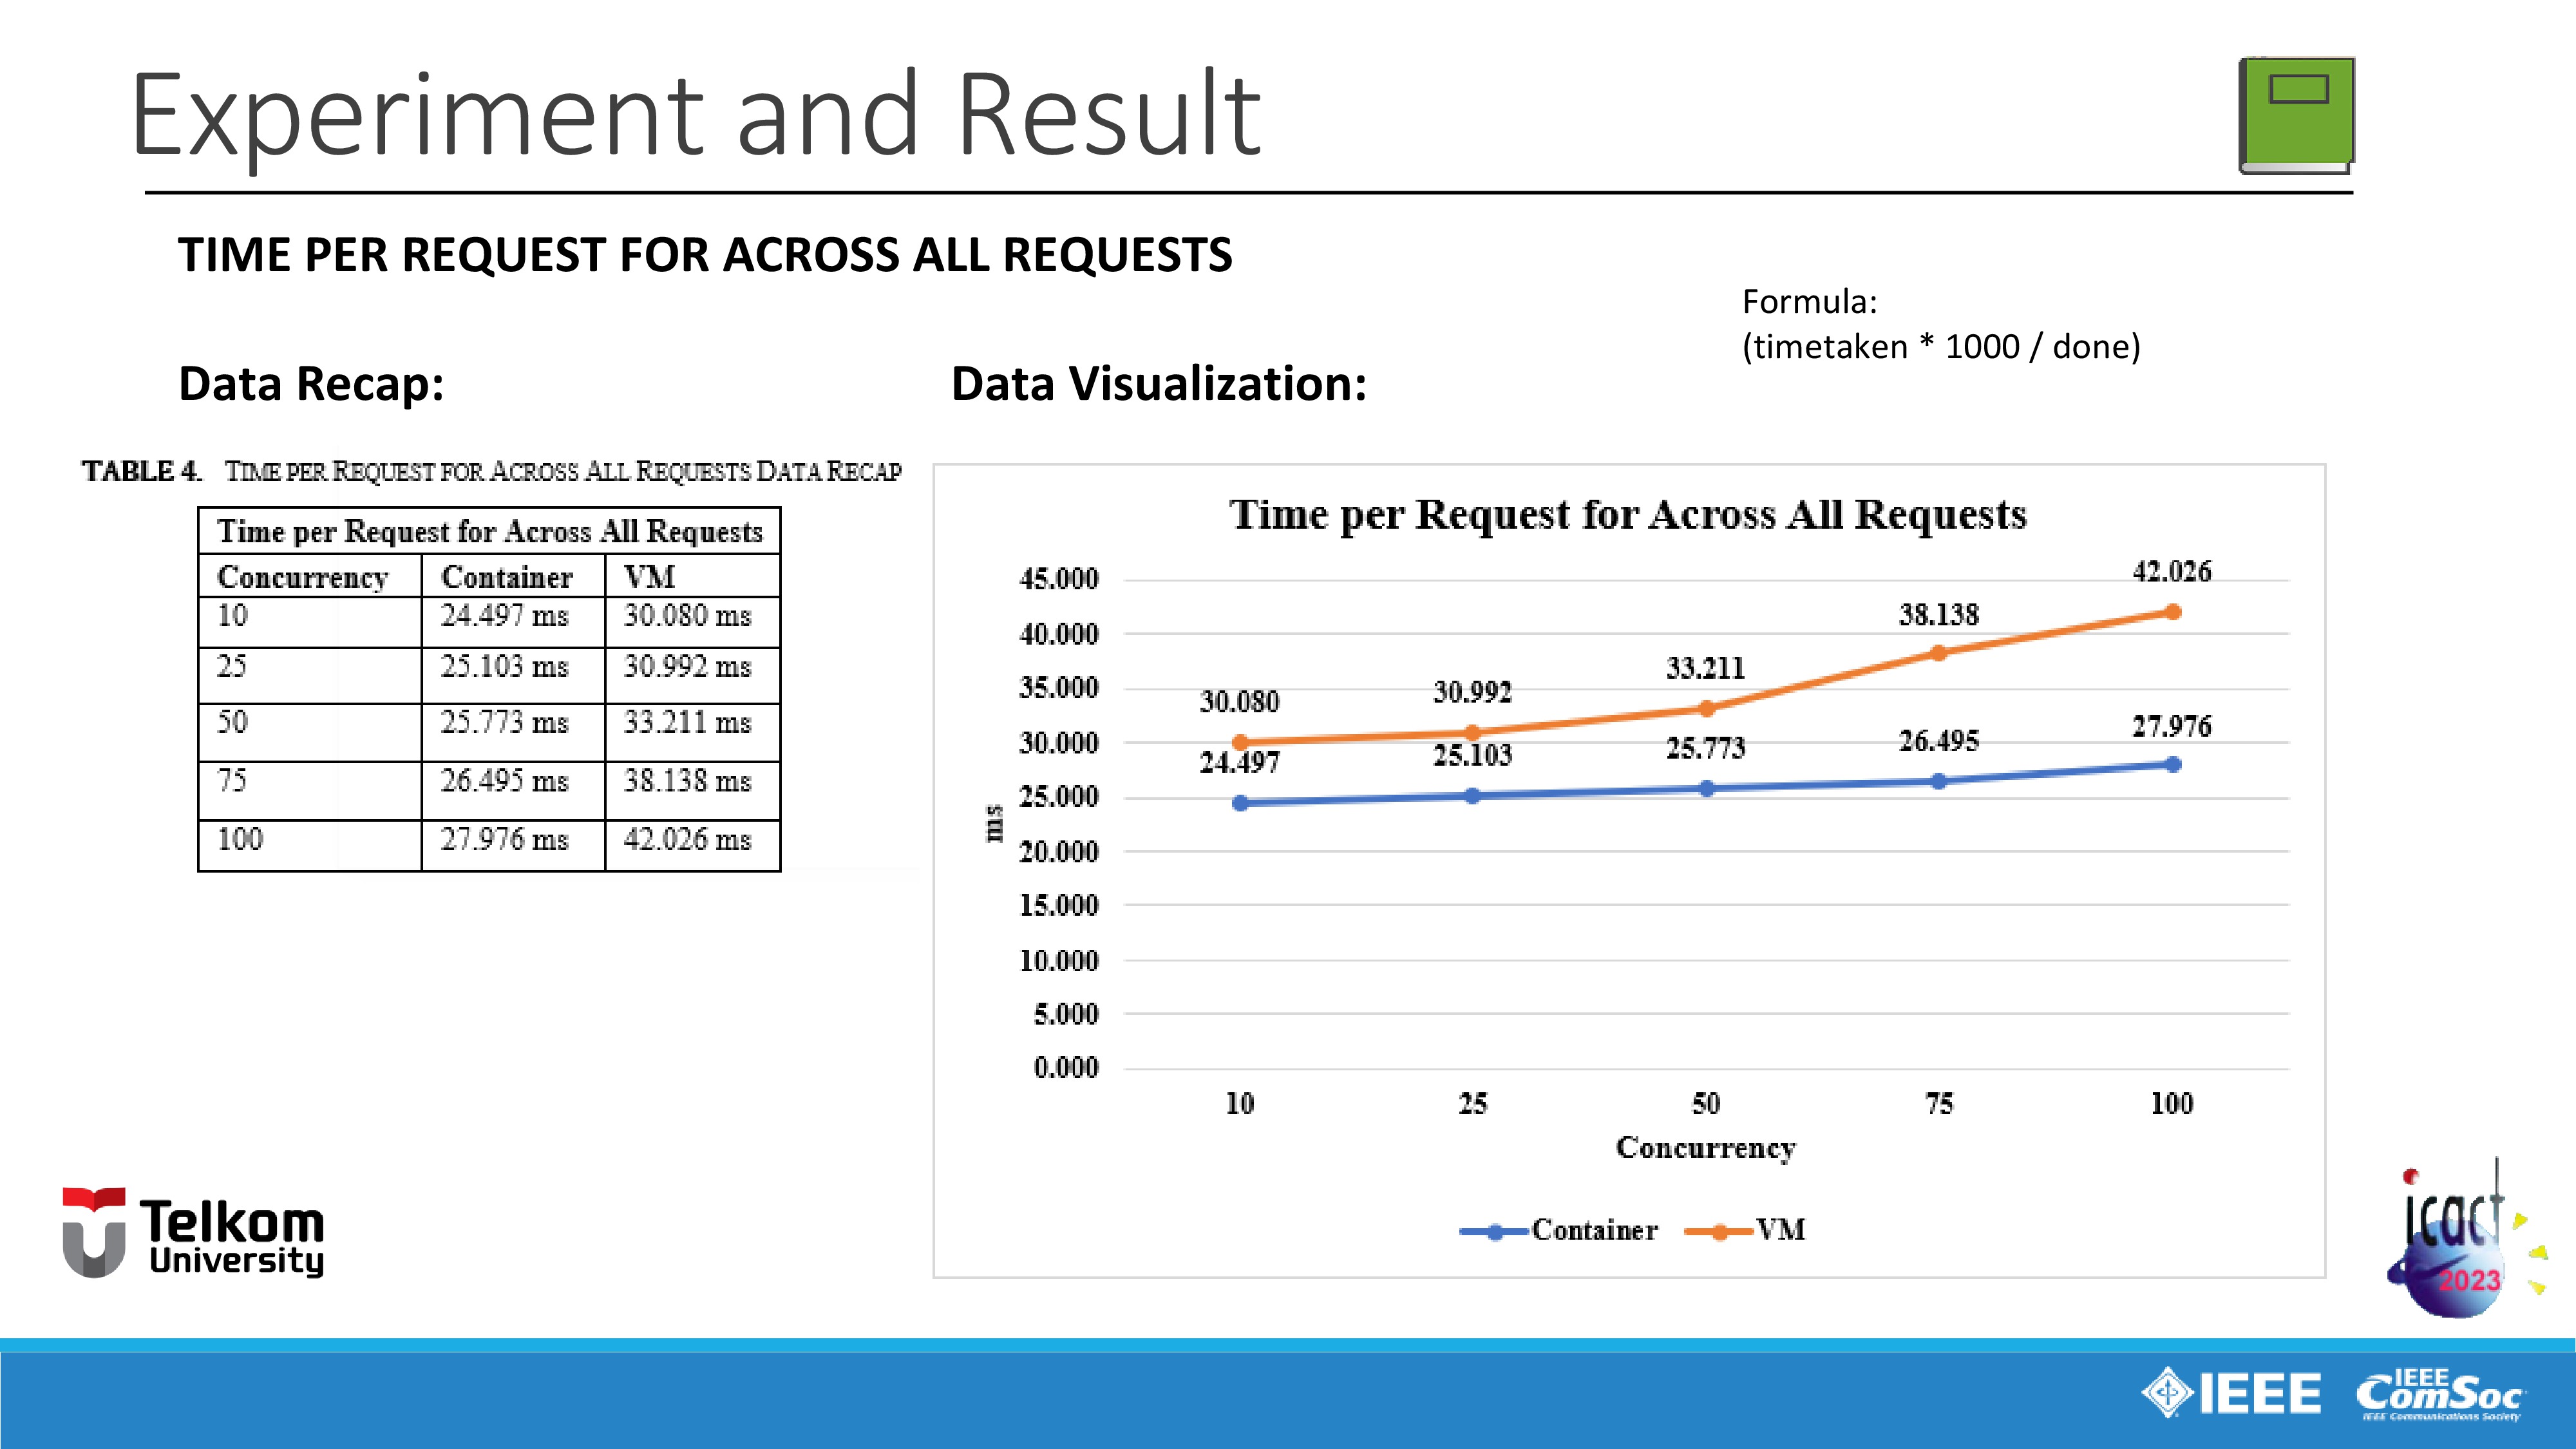 |
Next variable is average time spent per request for across all requests.
According to the Apache official website, The data in this variable is calculated with formula: (time taken for test times one thousand divided by the total requests that were successfully served)
Just like the previous variable, VM is taking more time than container. VM is taking time in span of thirty point eighty milliseconds until forty-two point twenty-six milliseconds.
Meanwhile container is taking time more less time in span of twenty four point four hundred and ninety seven milliseconds until twenty seven point nine hundred and seventy six milliseconds.
In this variable, similar things also happens with average Time spent per request for each concurrency variable. The reason is also same, the greater the concurrency, the more memory is needed for serving request for across all requests, so it means the greater the concurrency, the longer it takes to serve request for across all requests.
|
|
ICACT20230068 Slide.22
[Big slide for presentation]
[YouTube] |
Chrome Text-to-Speach Click!! |
 |
Next variable is average Time spent per request for each concurrency.
According to the Apache official website, the data in this variable is calculated with formula: (concurrency times time taken for test times one thousand divided by the total requests that were successfully served).
VM is taking time in span of three hundred points eight hundred and three milliseconds until four thousand two hundred two point six hundred and forty three milliseconds.
Meanwhile container is taking time in span of two hundred and forty-four points nine hundred and seventy-three milliseconds until two thousand seven hundred ninety seven point five hundred and eighty five milliseconds.
In this variable, similar things happens with Time taken for test variable which I have explained before. And the reason is also same, the greater the concurrency, the more memory is needed for serving request for each concurrency, so it means the greater the concurrency, the longer it takes to serve requests for each concurrency.
|
|
ICACT20230068 Slide.21
[Big slide for presentation]
[YouTube] |
Chrome Text-to-Speach Click!! |
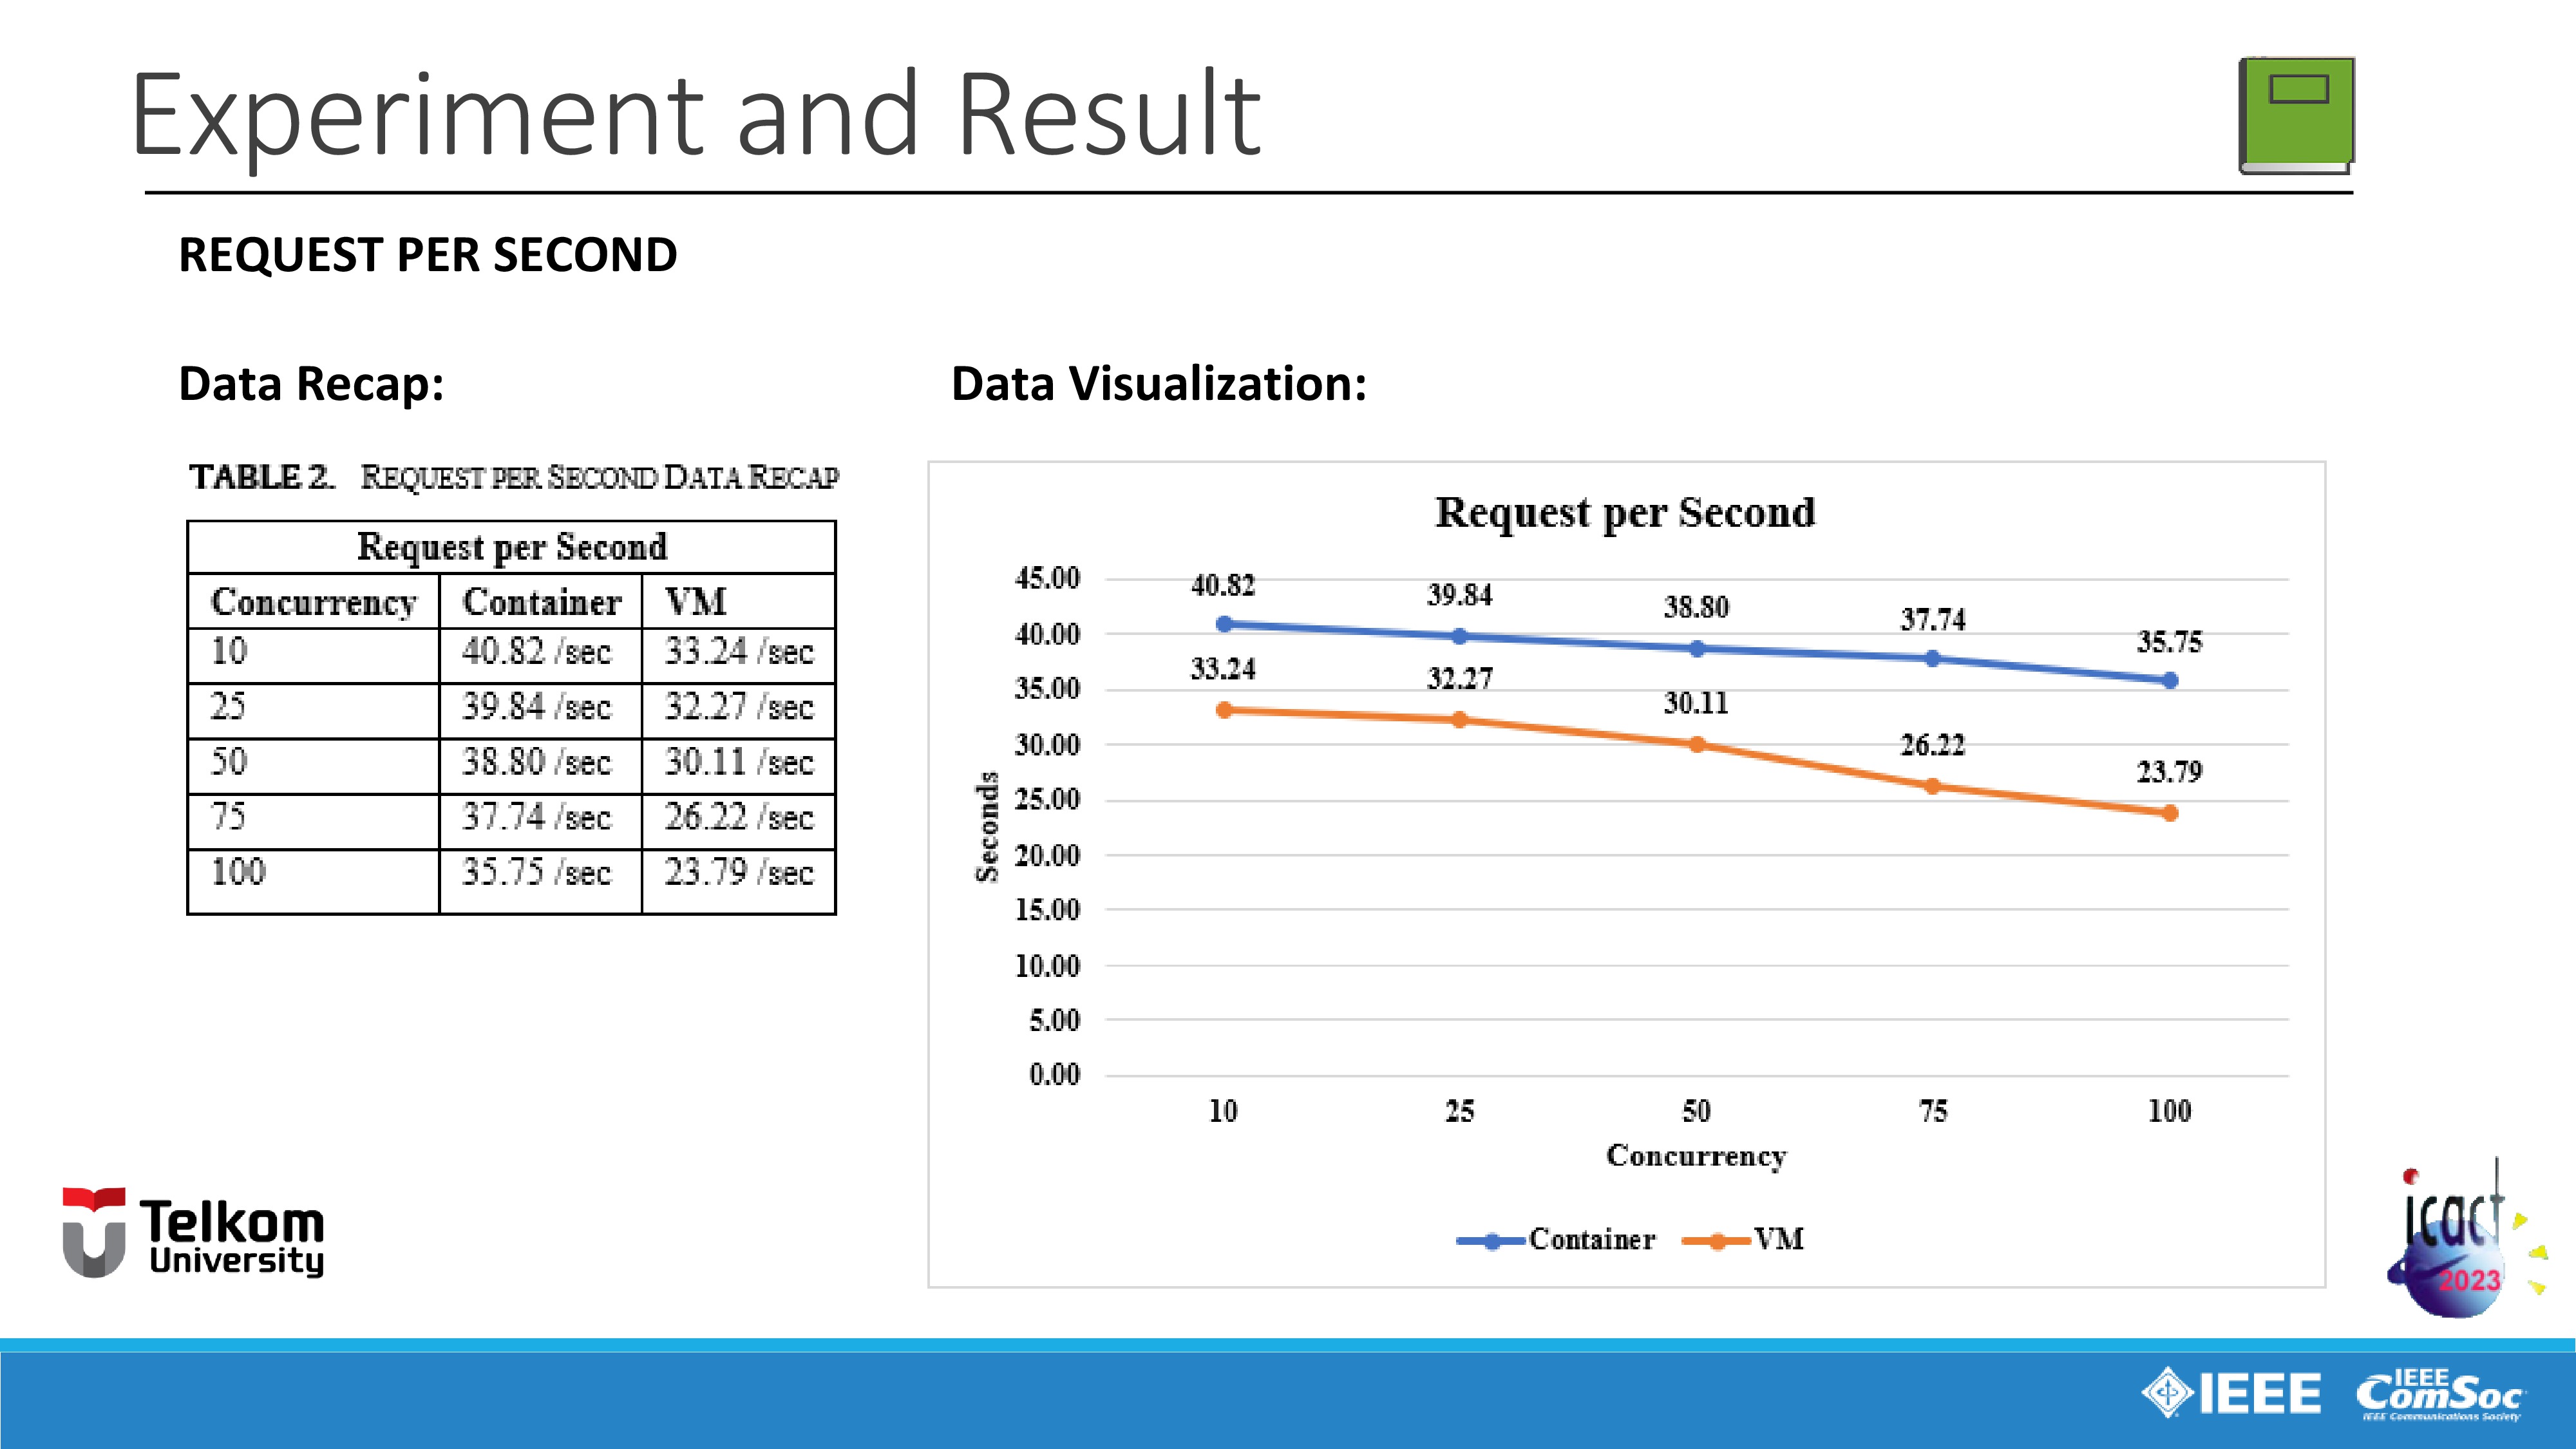 |
Next variable is request that needs to be served per second.
In terms of serving request per second, container virtualization is serving more request per second than VM.
Container virtualization serve requests in span of forty point eighty two requests per second until thirty five point seventy five requests per second.
Meanwhile VM serve fewer requests in span of thirty three point twenty four requests per second until twenty three seventy nine requests per second.
And also we can realize that the greater the concurrency, the lower the requests that needs to be served per second for each concurrency has.
This happens because the smaller the concurrency, the two virtualization methods have fewer queues for requests per second that need to be served, which means that both virtualization methods are not too busy with fewer queues for requests per second that need to be served.
|
|
ICACT20230068 Slide.20
[Big slide for presentation]
[YouTube] |
Chrome Text-to-Speach Click!! |
 |
So we moving on to benchmarking data recap and visualization.
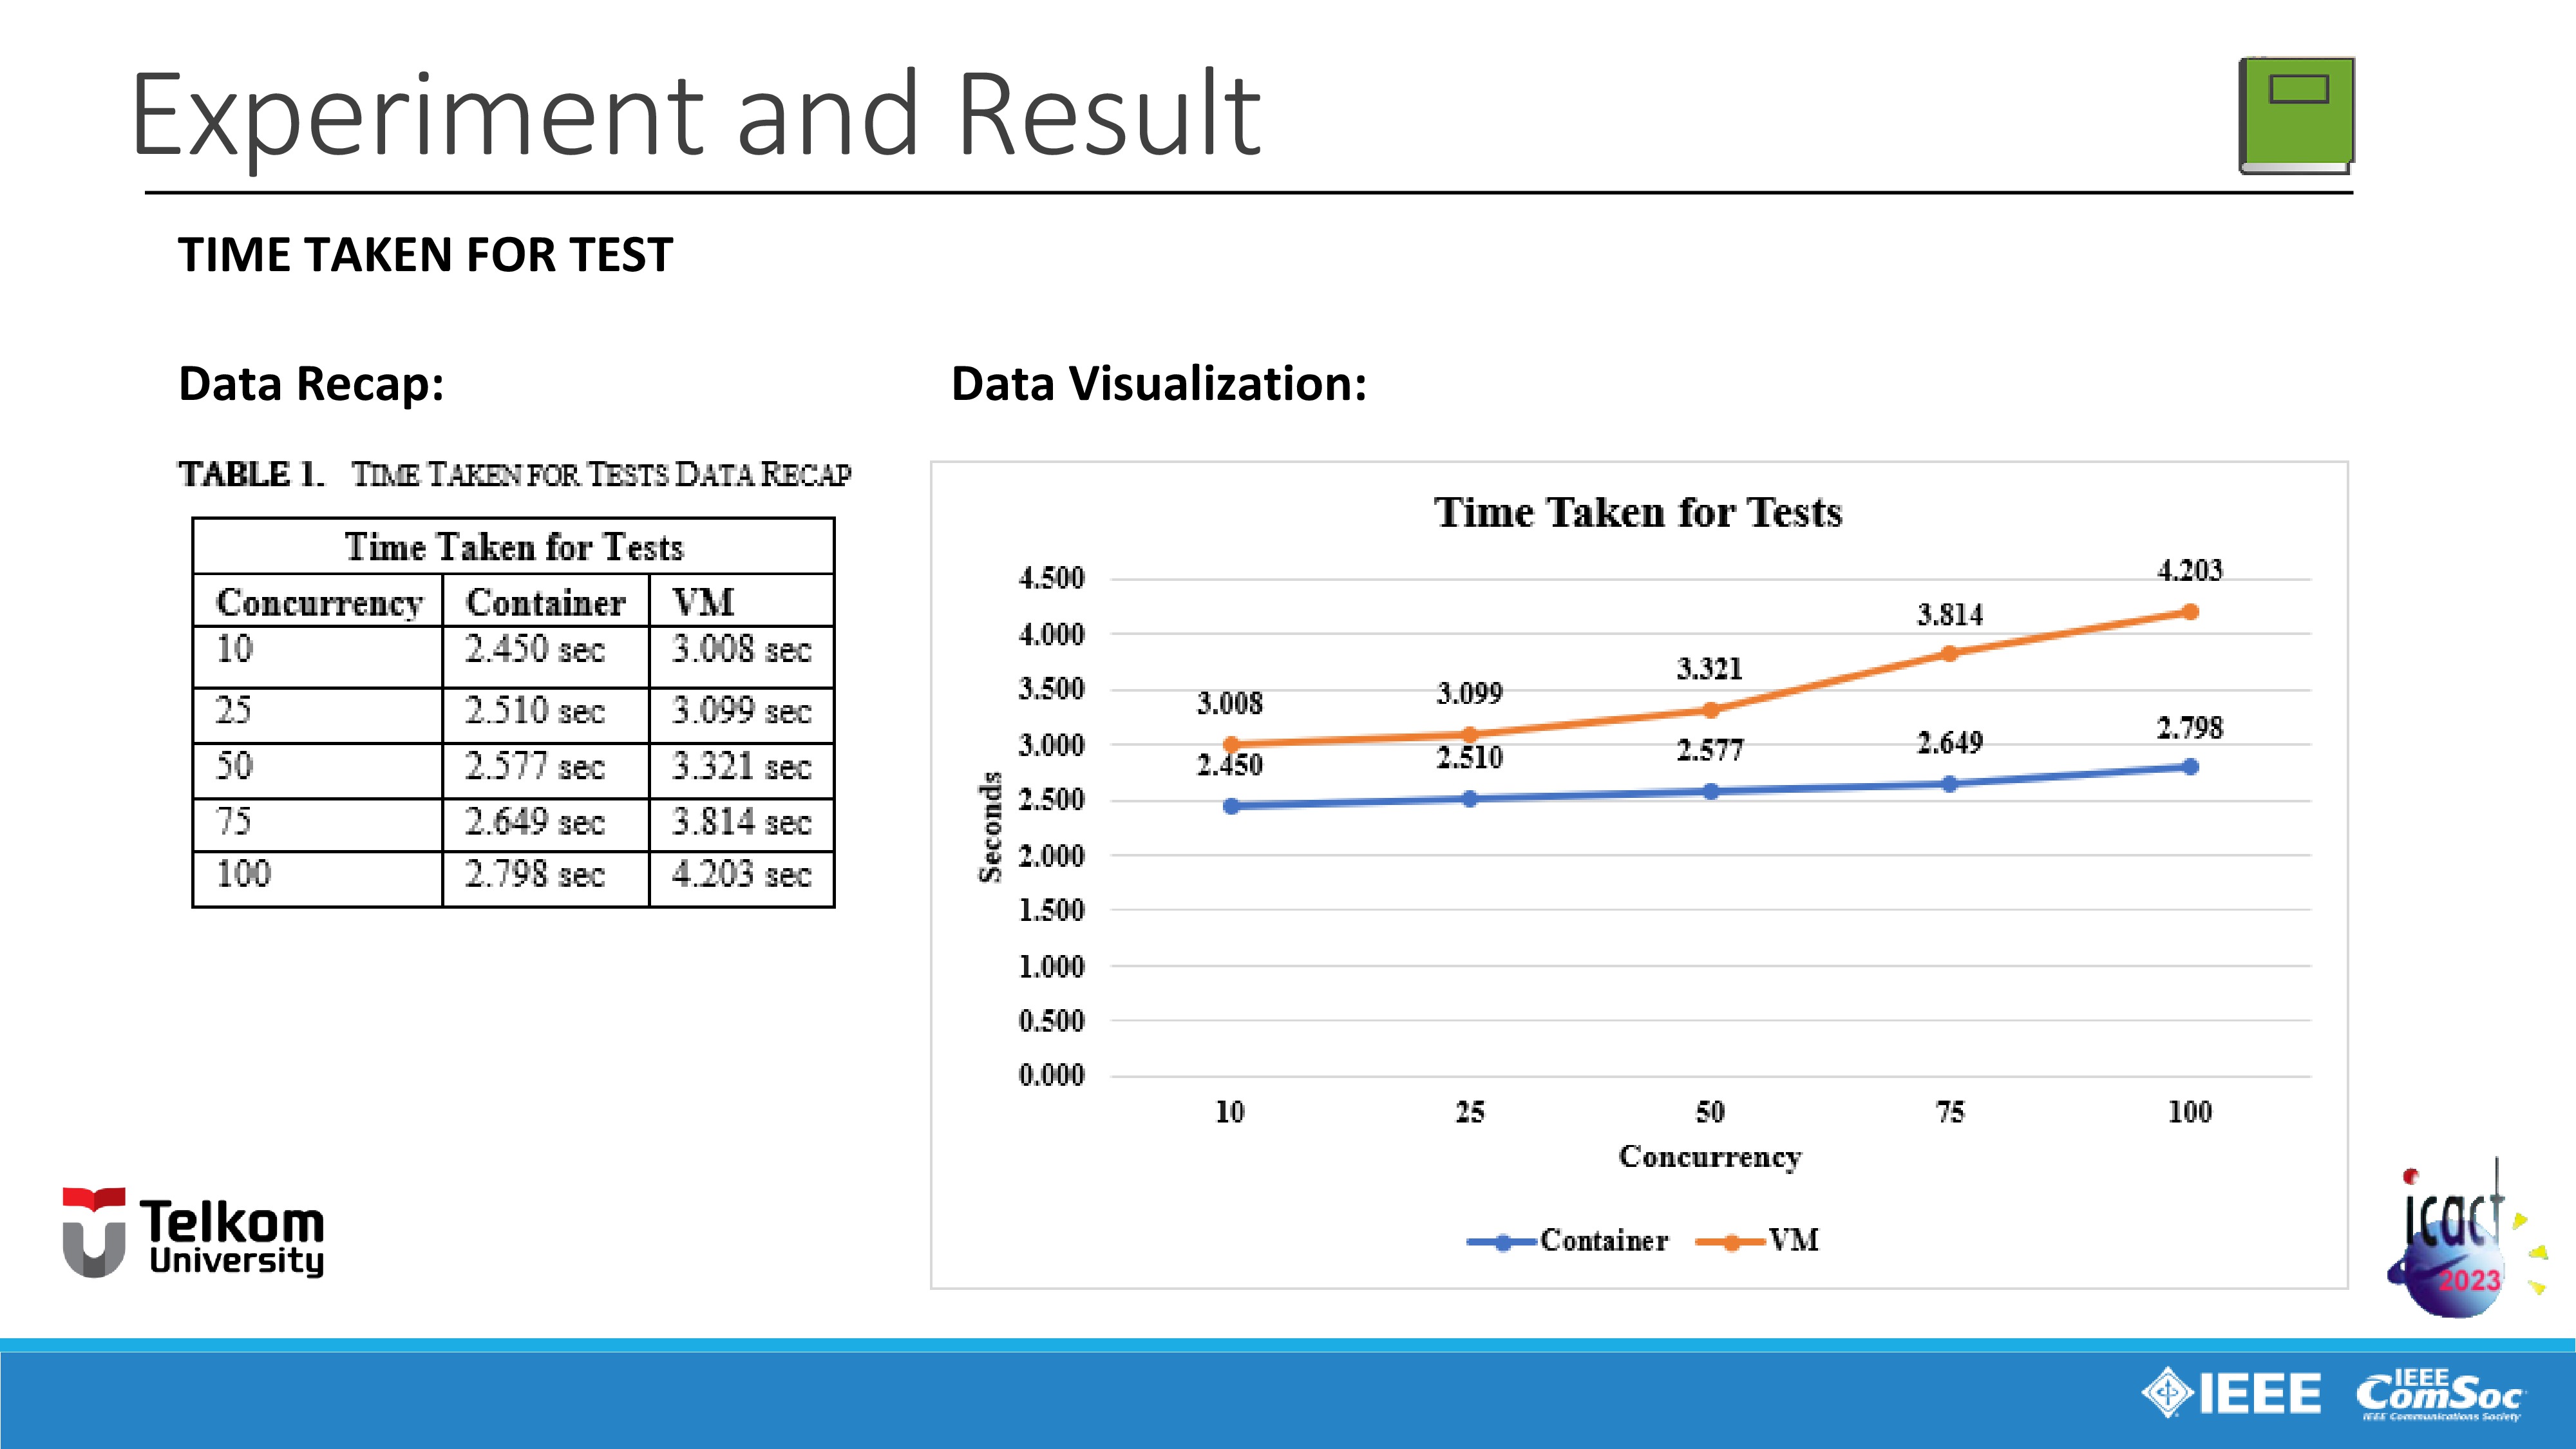
First is for the variable time taken for one session of benchmarking test.
As we can see in the data recap and visualization, VM virtualization marked in orange line is taking more time for one session of benchmarking test than container virtualization, marked in blue line. The VM virtualization takes in span of three until four seconds to complete the test meanwhile the container virtualization is taking less time than VM in just span of two seconds.
And also we can see that, the greater the concurrency, the longer it takes to complete the test session.
For example, using the ten concurrency parameter, VM needs three point eight seconds to complete the test, and then for twenty five concurrency parameter, the time needed is increasing to three point ninenty nine seconds, and its and continues to increase constantly for fifty concurrency, seventy-five concurrency, and finally in one hundred concurrency parameters the VM needs four point two hundred and three seconds. And the same thing is also happened to container virtualization, the time required increases as concurrency increases too.
This happens because the greater the concurrency, the more memory is needed for the test session, that means the greater the concurrency, the more time it takes to complete the test session.
|
|
ICACT20230068 Slide.19
[Big slide for presentation]
[YouTube] |
Chrome Text-to-Speach Click!! |
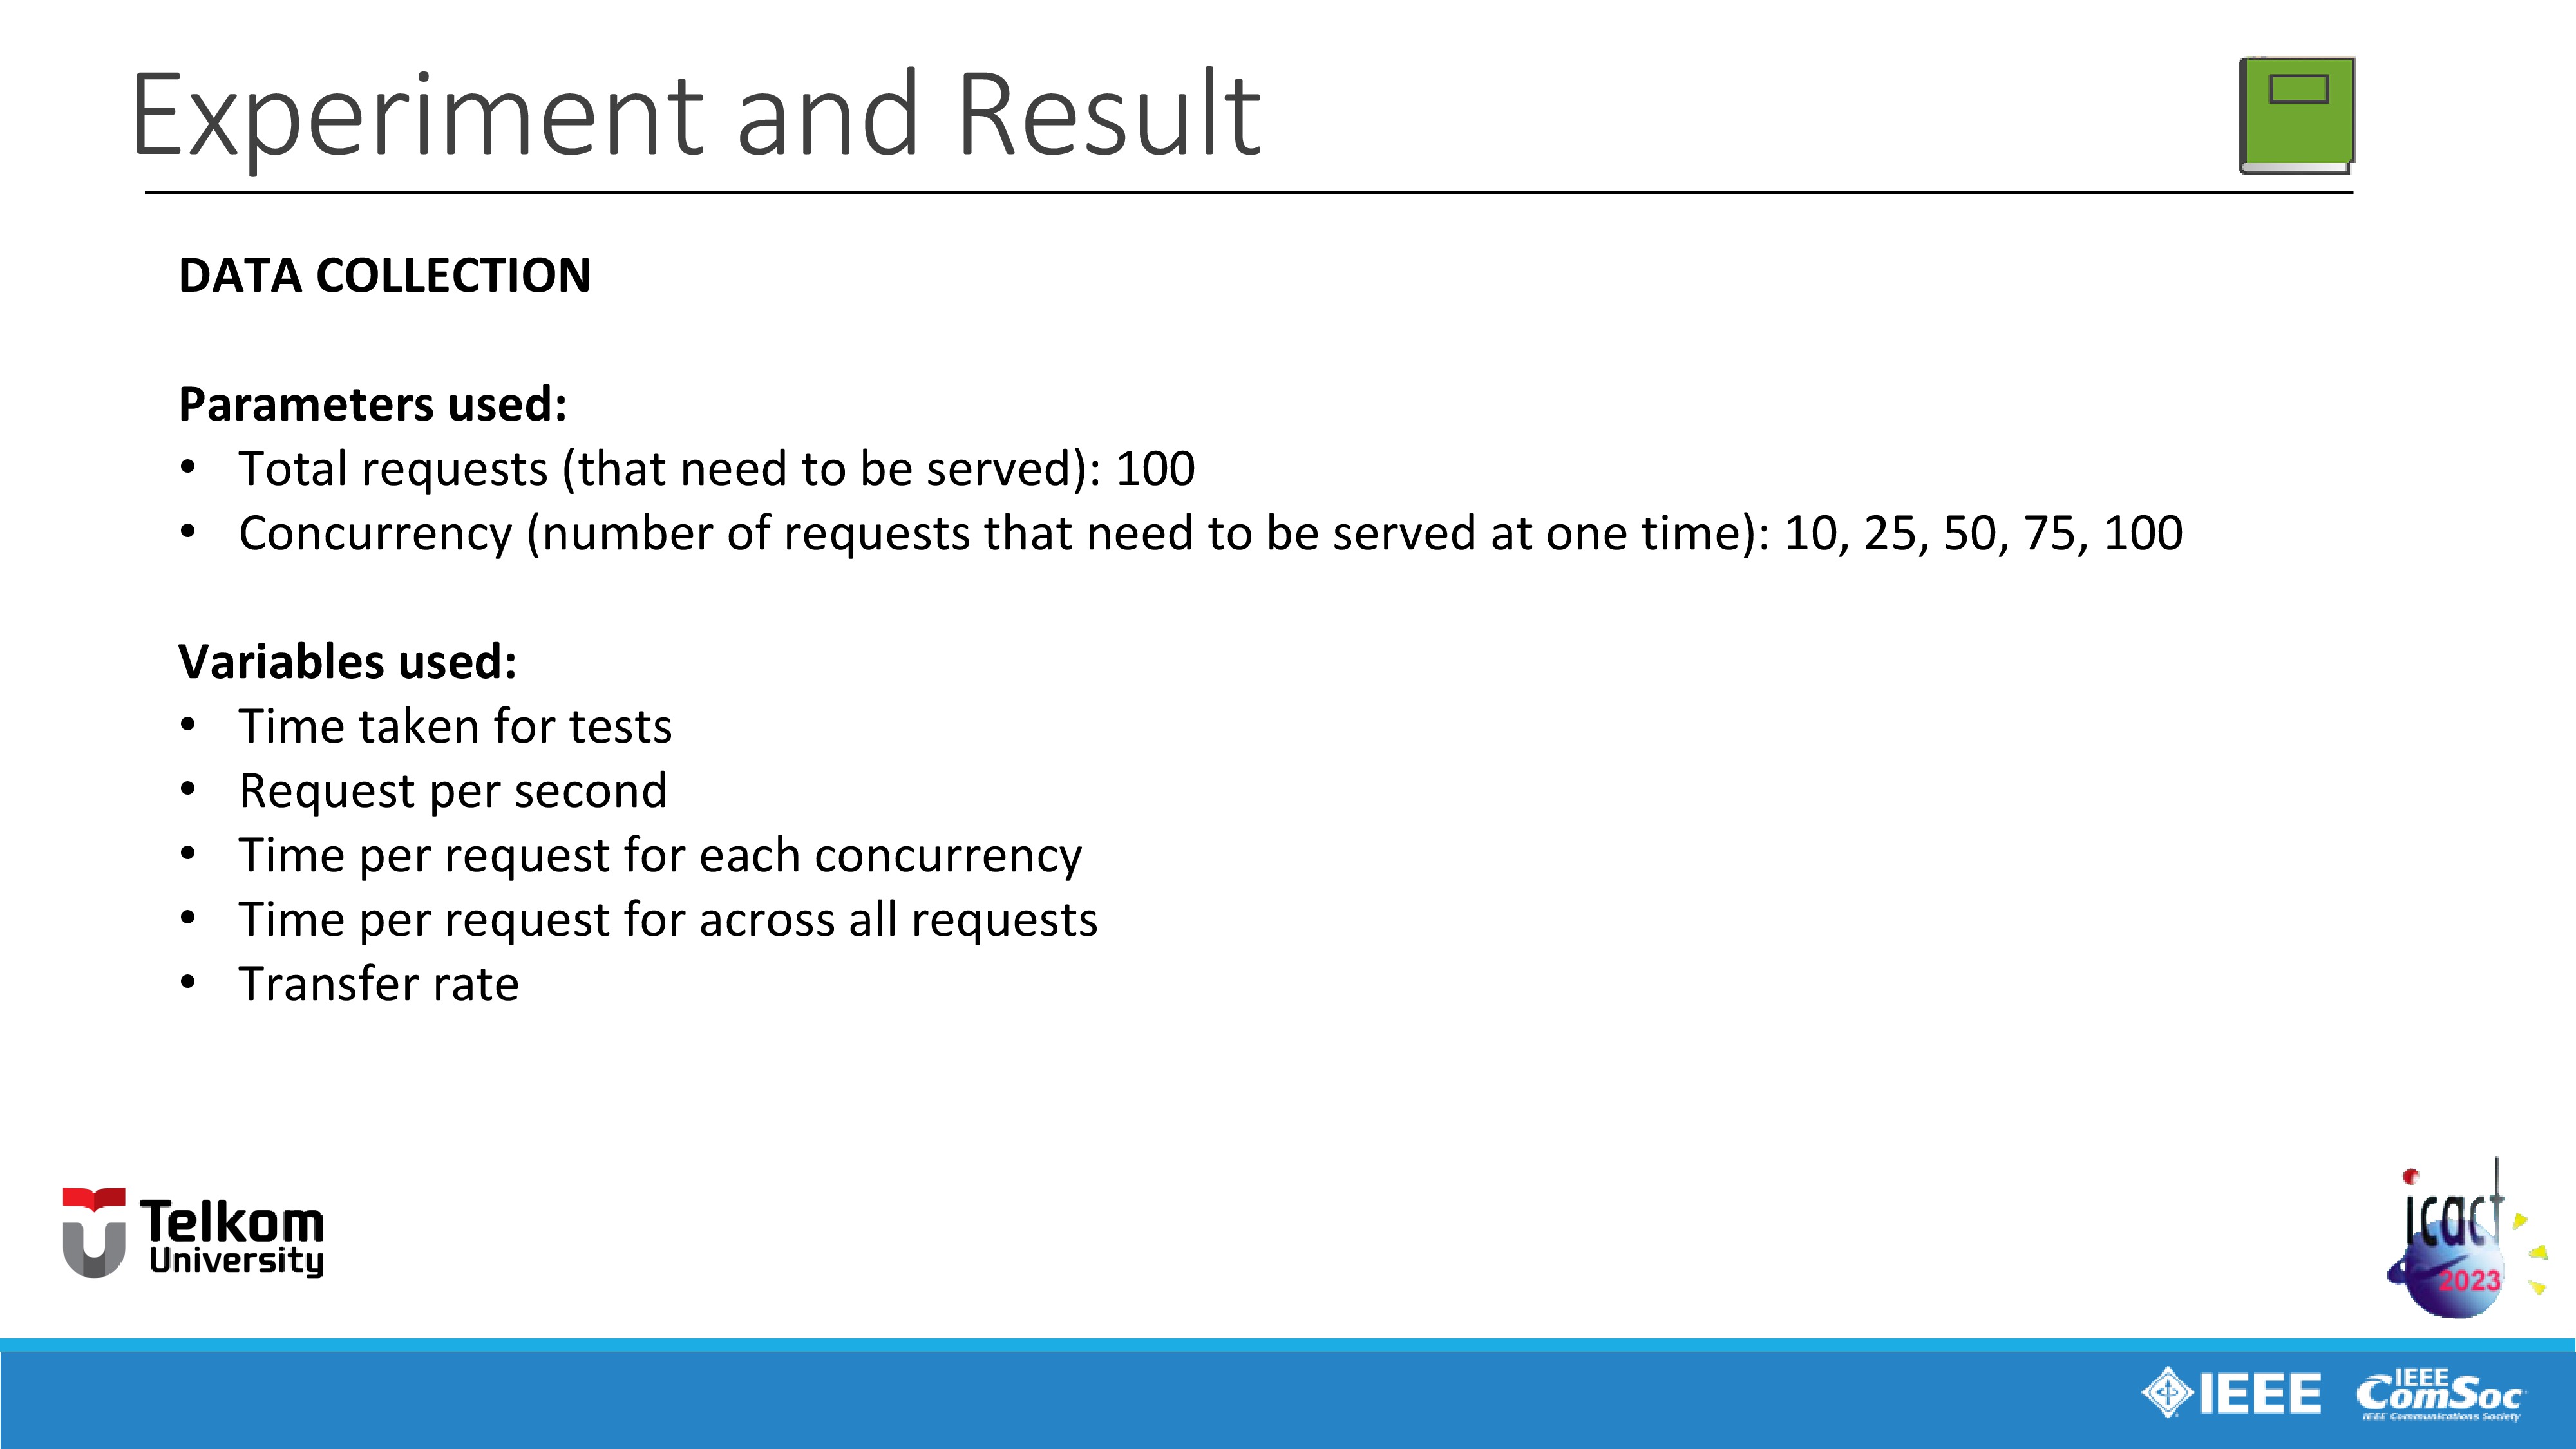 |
Next I will explain about the parameters and variables used in this study.
For the parameters, We use 100 Total requests (that need to be served)
and 10, 25, 50, 75, 100 Concurrency number of requests that need to be served at one time.
And for the variables we use five different variables:
- Time taken for tests.
- Request per second.
- Time per request for each concurrency.
- Time per request for across all requests.
- Transfer rate of data.
|
|
ICACT20230068 Slide.18
[Big slide for presentation]
[YouTube] |
Chrome Text-to-Speach Click!! |
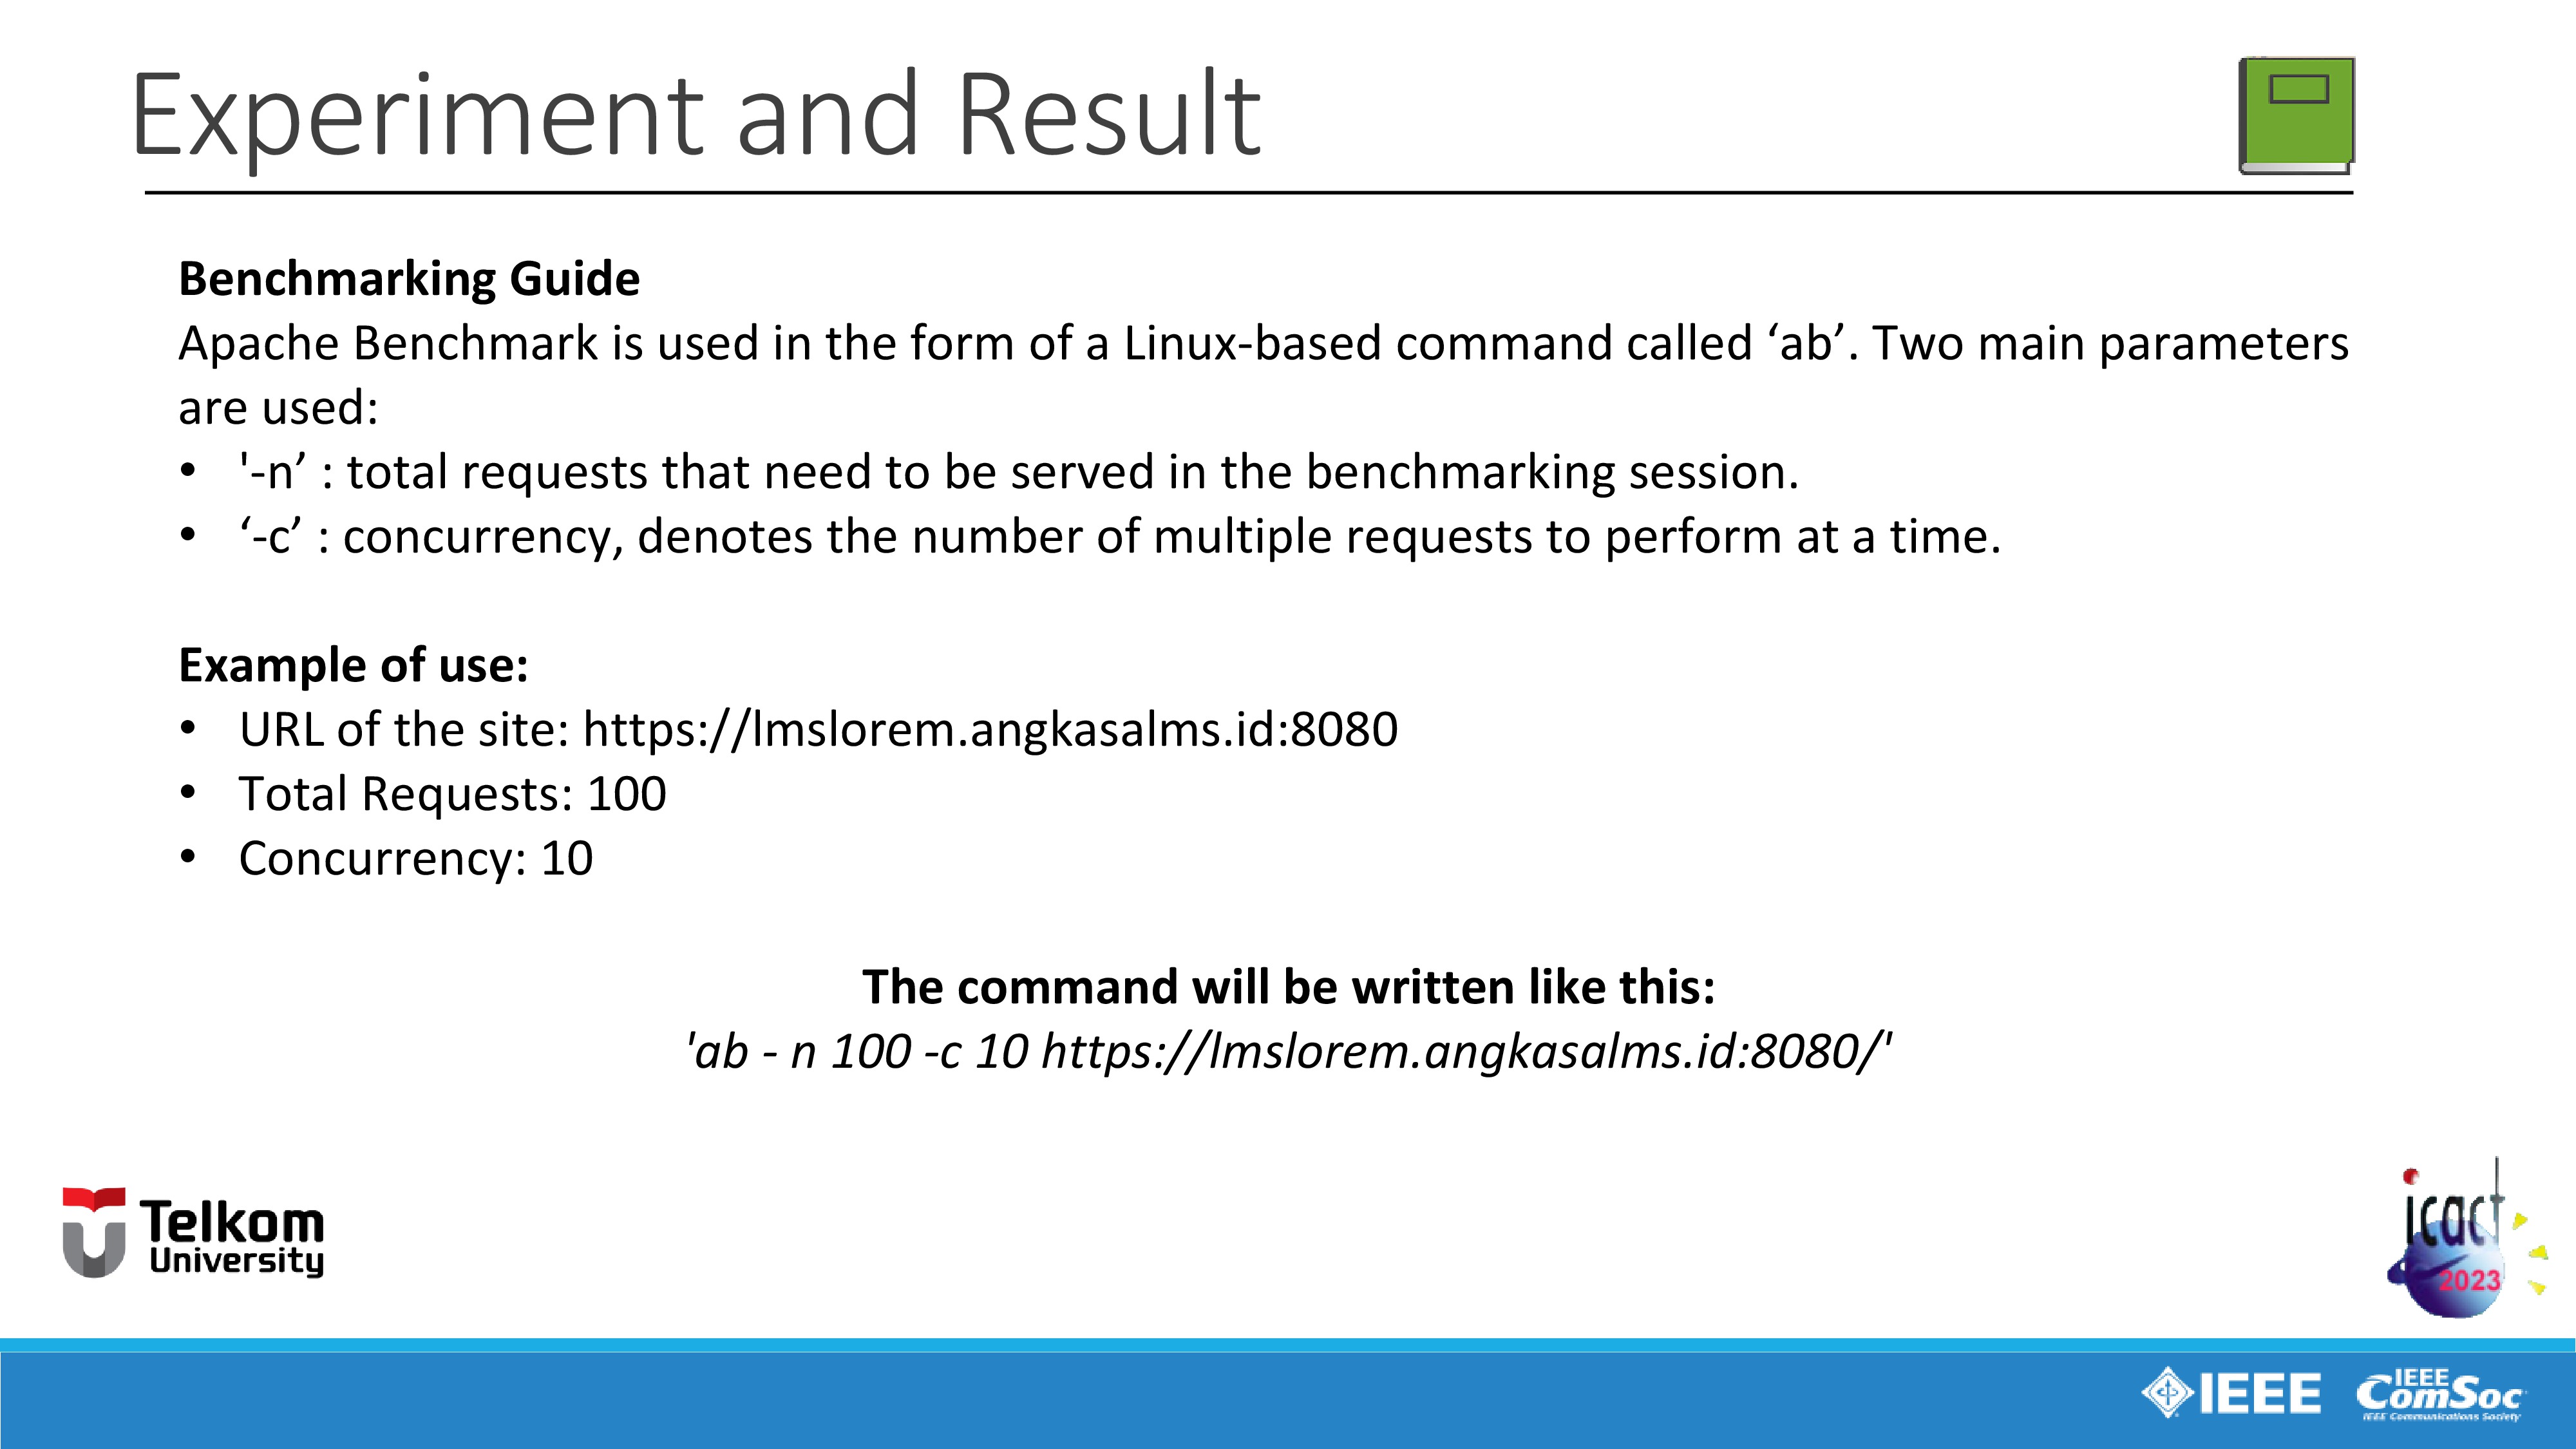 |
And next I will explain about benchmarking guide. As explained before, Apache Benchmark is used in the form of a Linux-based command called ‘ab’. And these are the two main parameters used in this study:
First is, '-n’ means the total requests that need to be served in the benchmarking session.
And next is ‘-c’ means the concurrency, denotes the number of multiple requests to perform at a time.
I will also explain the example of use of the 'ab' command.
For example we want to do a benchmarking session of a website with the URL https://lmslorem.angkasalms.id:8080 with the parameters are, 100 total request, and 10 concurrency.
Then the command will be written like this:
'ab -n 100 (means 100 total requests that need to be served in the benchmarking session) -c 10 (means 10 concurrency denotes the number of multiple requests to perform at a time) and the URL of the website: https://lmslorem.angkasalms.id:8080'.
|
|
ICACT20230068 Slide.17
[Big slide for presentation]
[YouTube] |
Chrome Text-to-Speach Click!! |
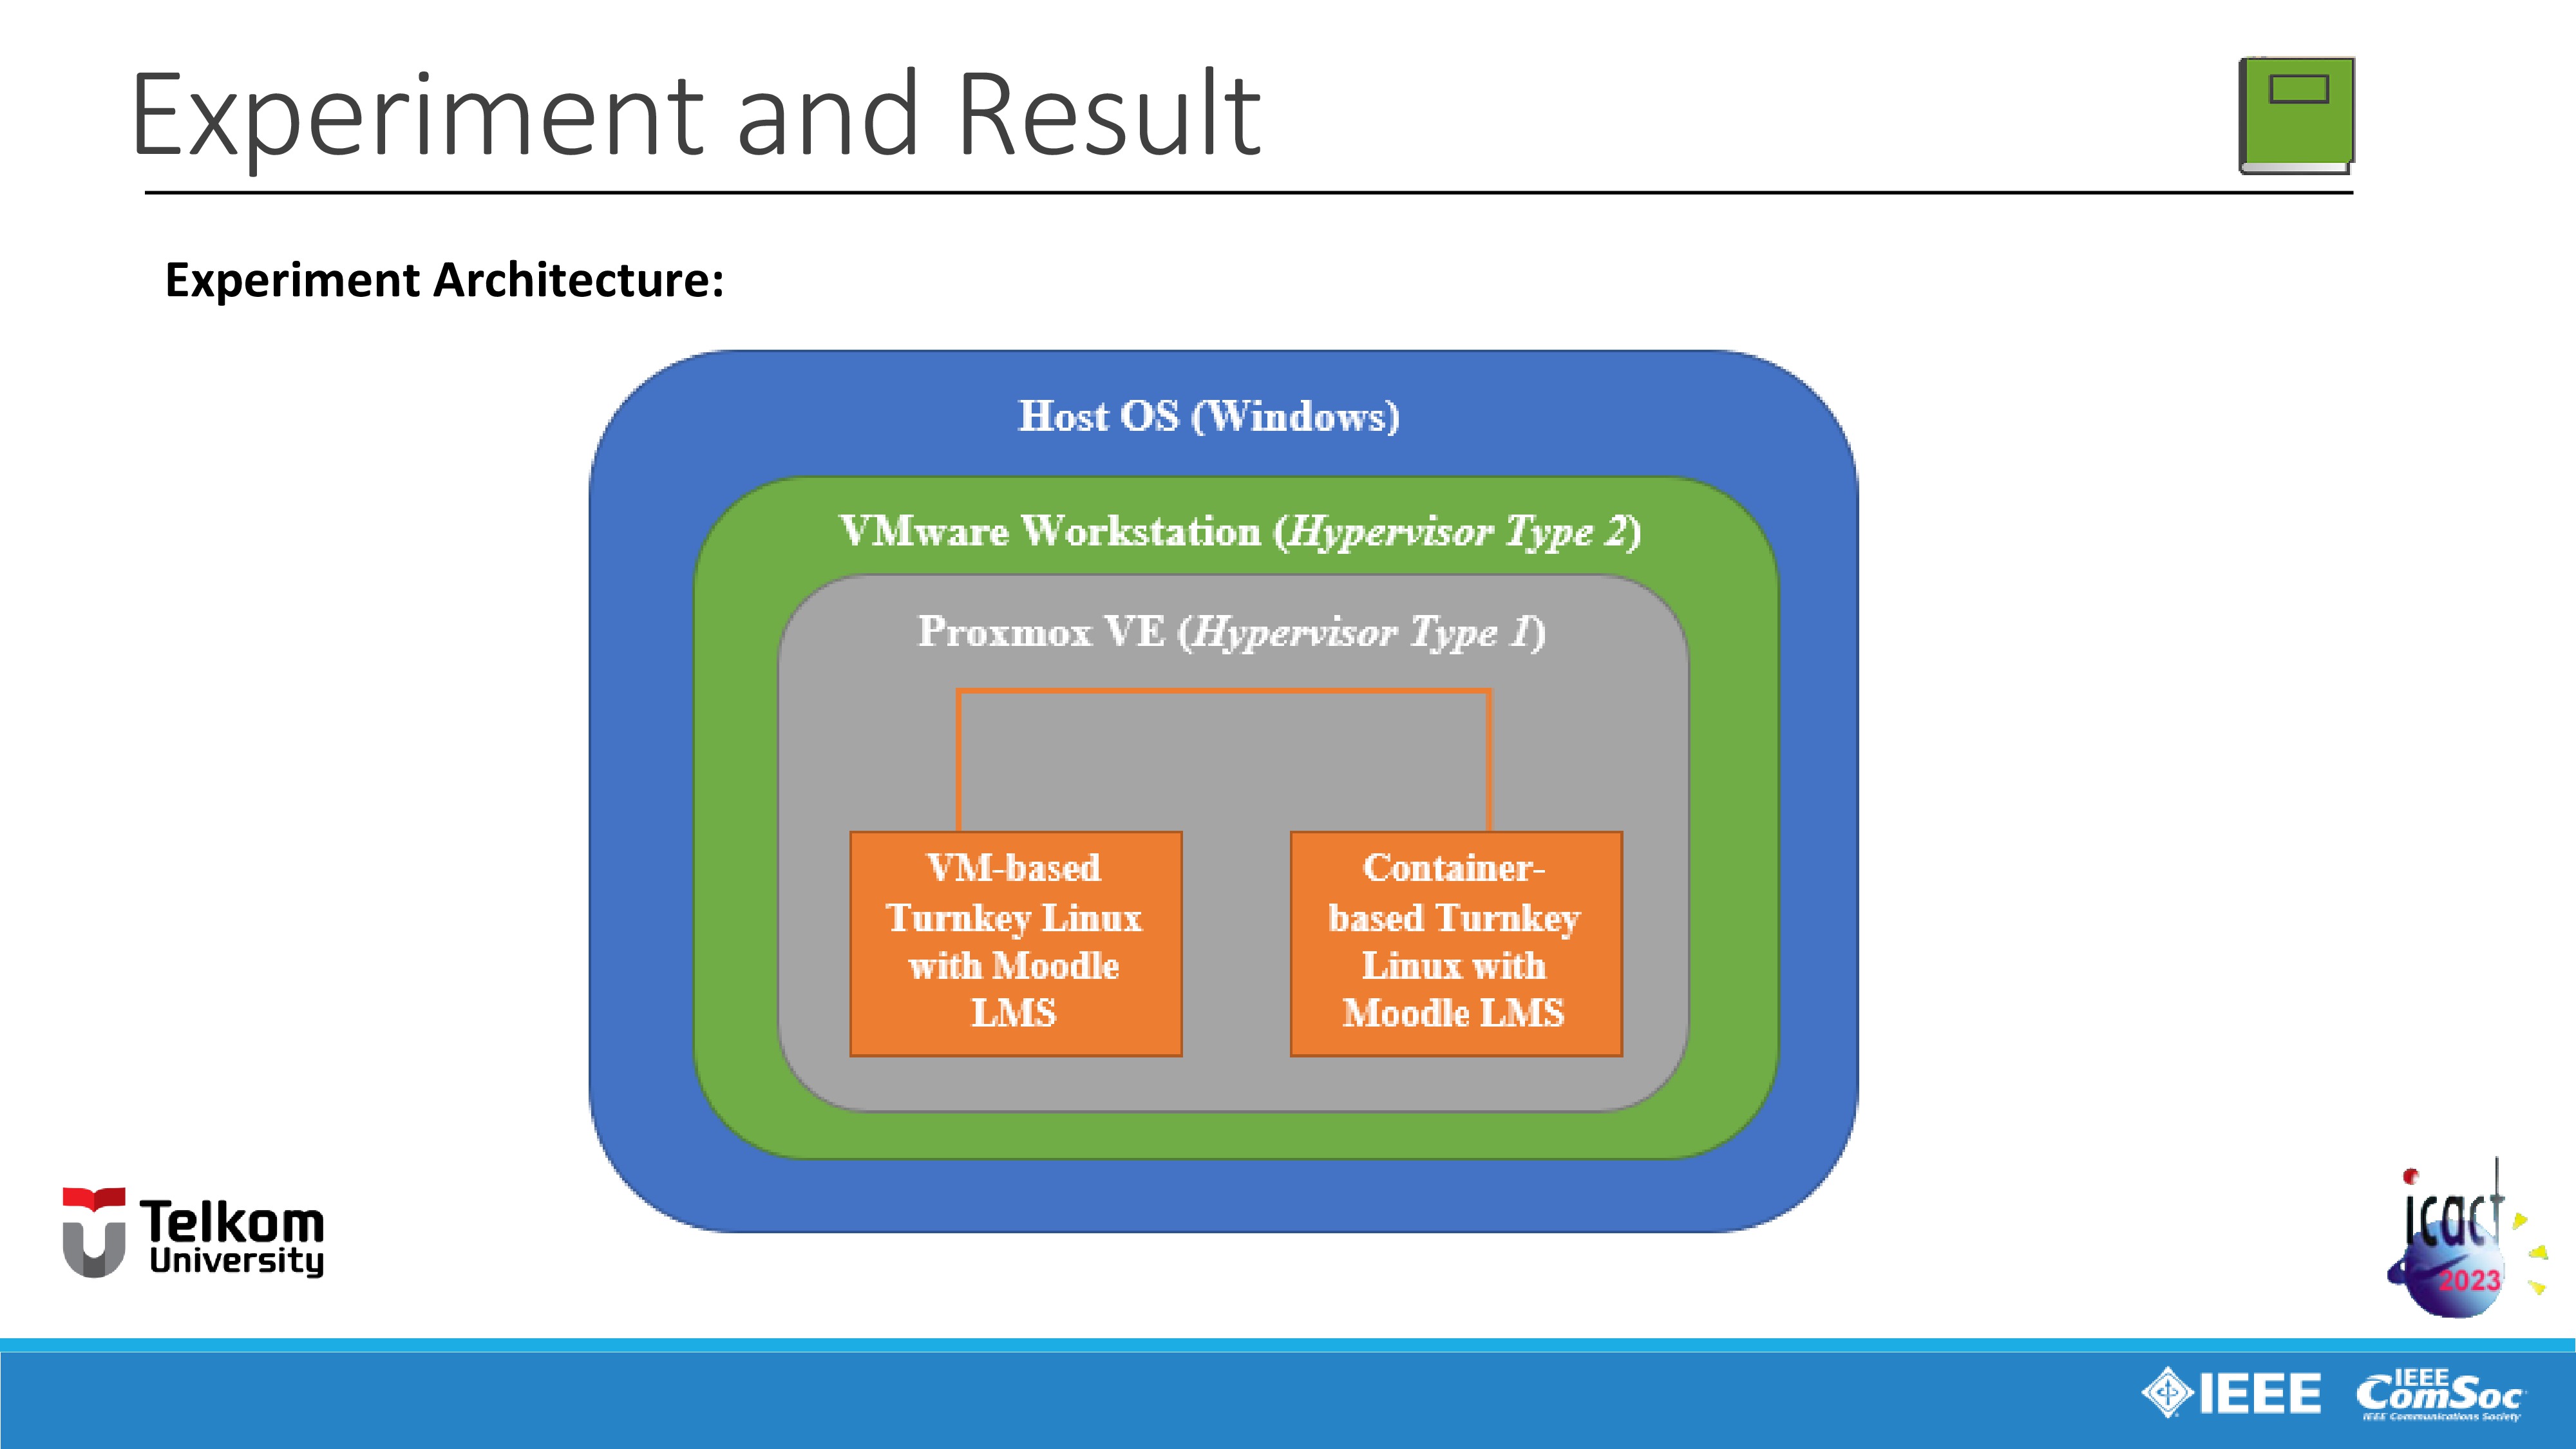 |
Next, I will explain about the experiment architecture.
Marked in blue, Microsoft Windows 10 as the Host operating system installed in Personal Computer.
Marked in green, VMware workstation software as hypervisor type 2.
Marked in grey, is Proxmox Virtual Environment as hypervisor type 1 installed in VMware workstation as hypervisor type 2 due to the hardware limitations as mentioned before.
And marked in orange, Turnkey Linux integrated with Moodle e-learning platform is virtualized inside the Proxmox Virtual Environment as hypervisor type 1 using both method of virtualization, full virtualization or VM and container virtualization.
|
|
ICACT20230068 Slide.16
[Big slide for presentation]
[YouTube] |
Chrome Text-to-Speach Click!! |
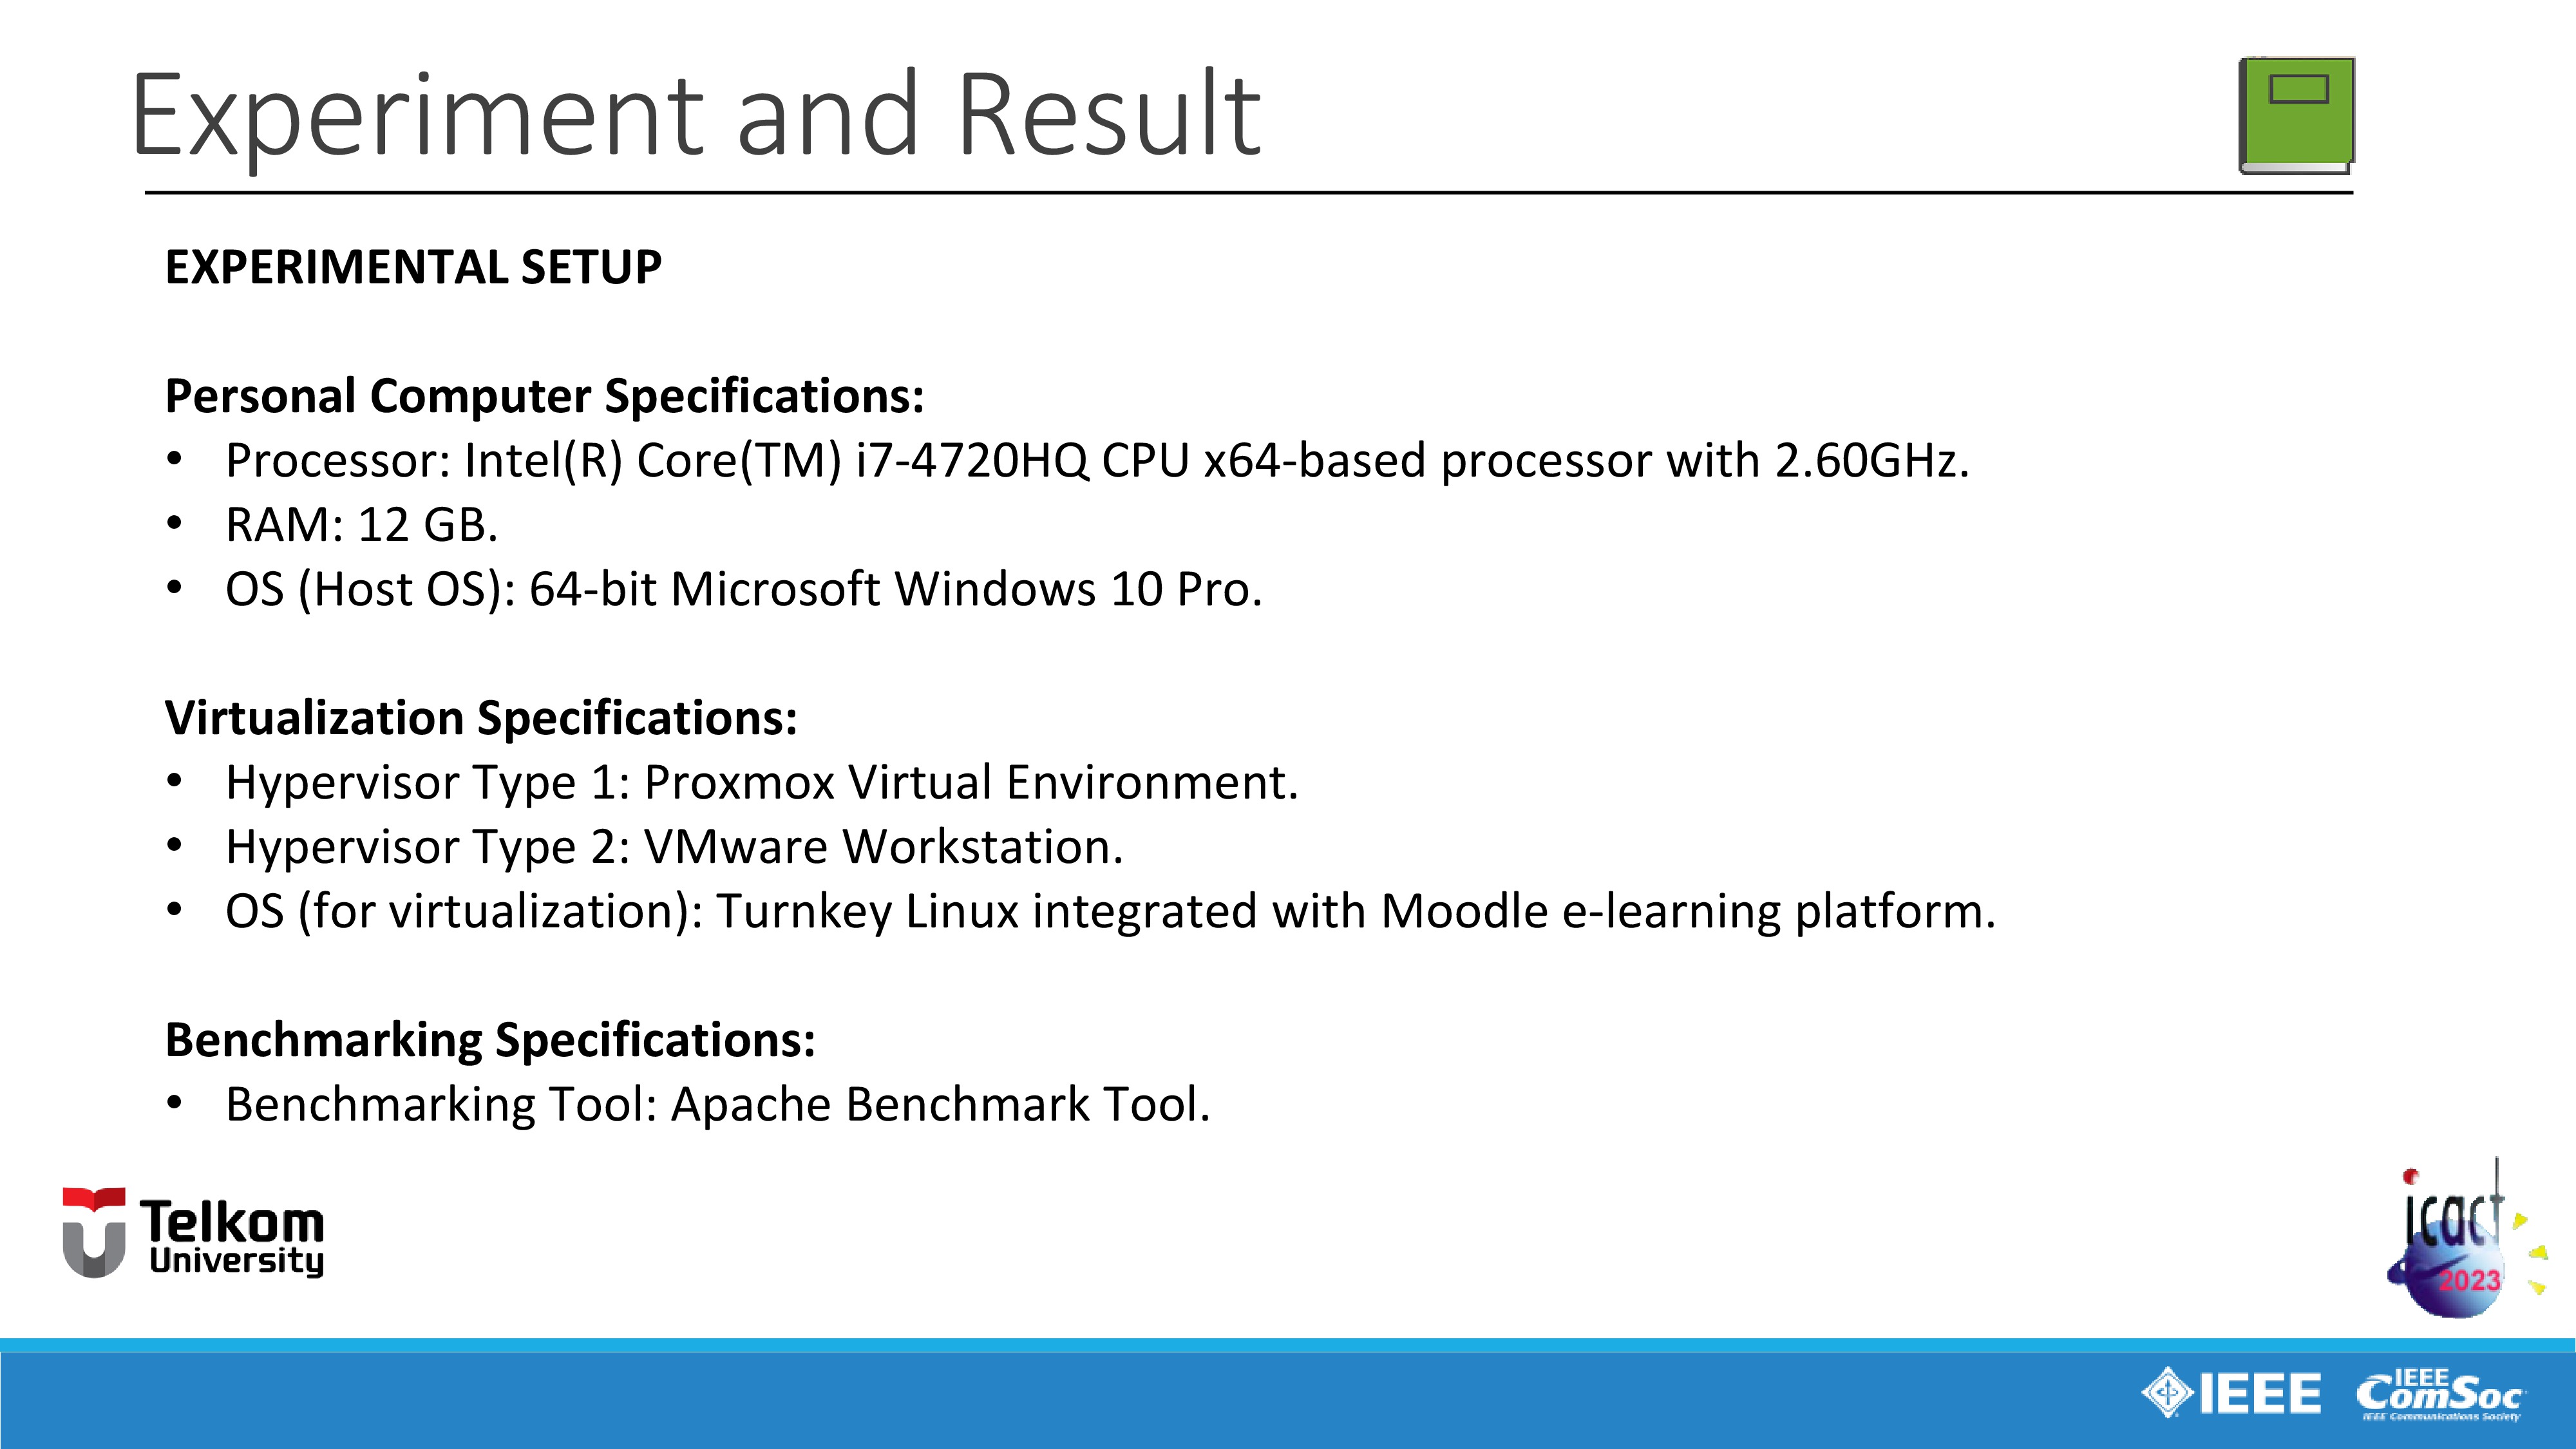 |
First I will explain about the experimental set-up.
First, Personal Computer Specifications are:
Processor: Intel(R) Core(TM) i7-4720HQ CPU x64-based processor with 2.60GHz.
RAM: 12 GB of RAM (Random Access Memory).
OS (as the Host Operating System) used is 64-bit Microsoft Windows 10 Pro.
Next, Virtualization Specifications are:
We use Proxmox Virtual Environment as Hypervisor Type 1
We use VMware Workstation as Hypervisor Type 2.
OS (as the guest operating system for virtualization) used is Turnkey Linux integrated with Moodle e-learning platform.
Last, Benchmarking Specifications, we use Apache Benchmark Tool as the Benchmarking Tool.
|
|
ICACT20230068 Slide.15
[Big slide for presentation]
[YouTube] |
Chrome Text-to-Speach Click!! |
 |
Next we moving on to the fourth part, Experiment and Result.
|
|
ICACT20230068 Slide.14
[Big slide for presentation]
[YouTube] |
Chrome Text-to-Speach Click!! |
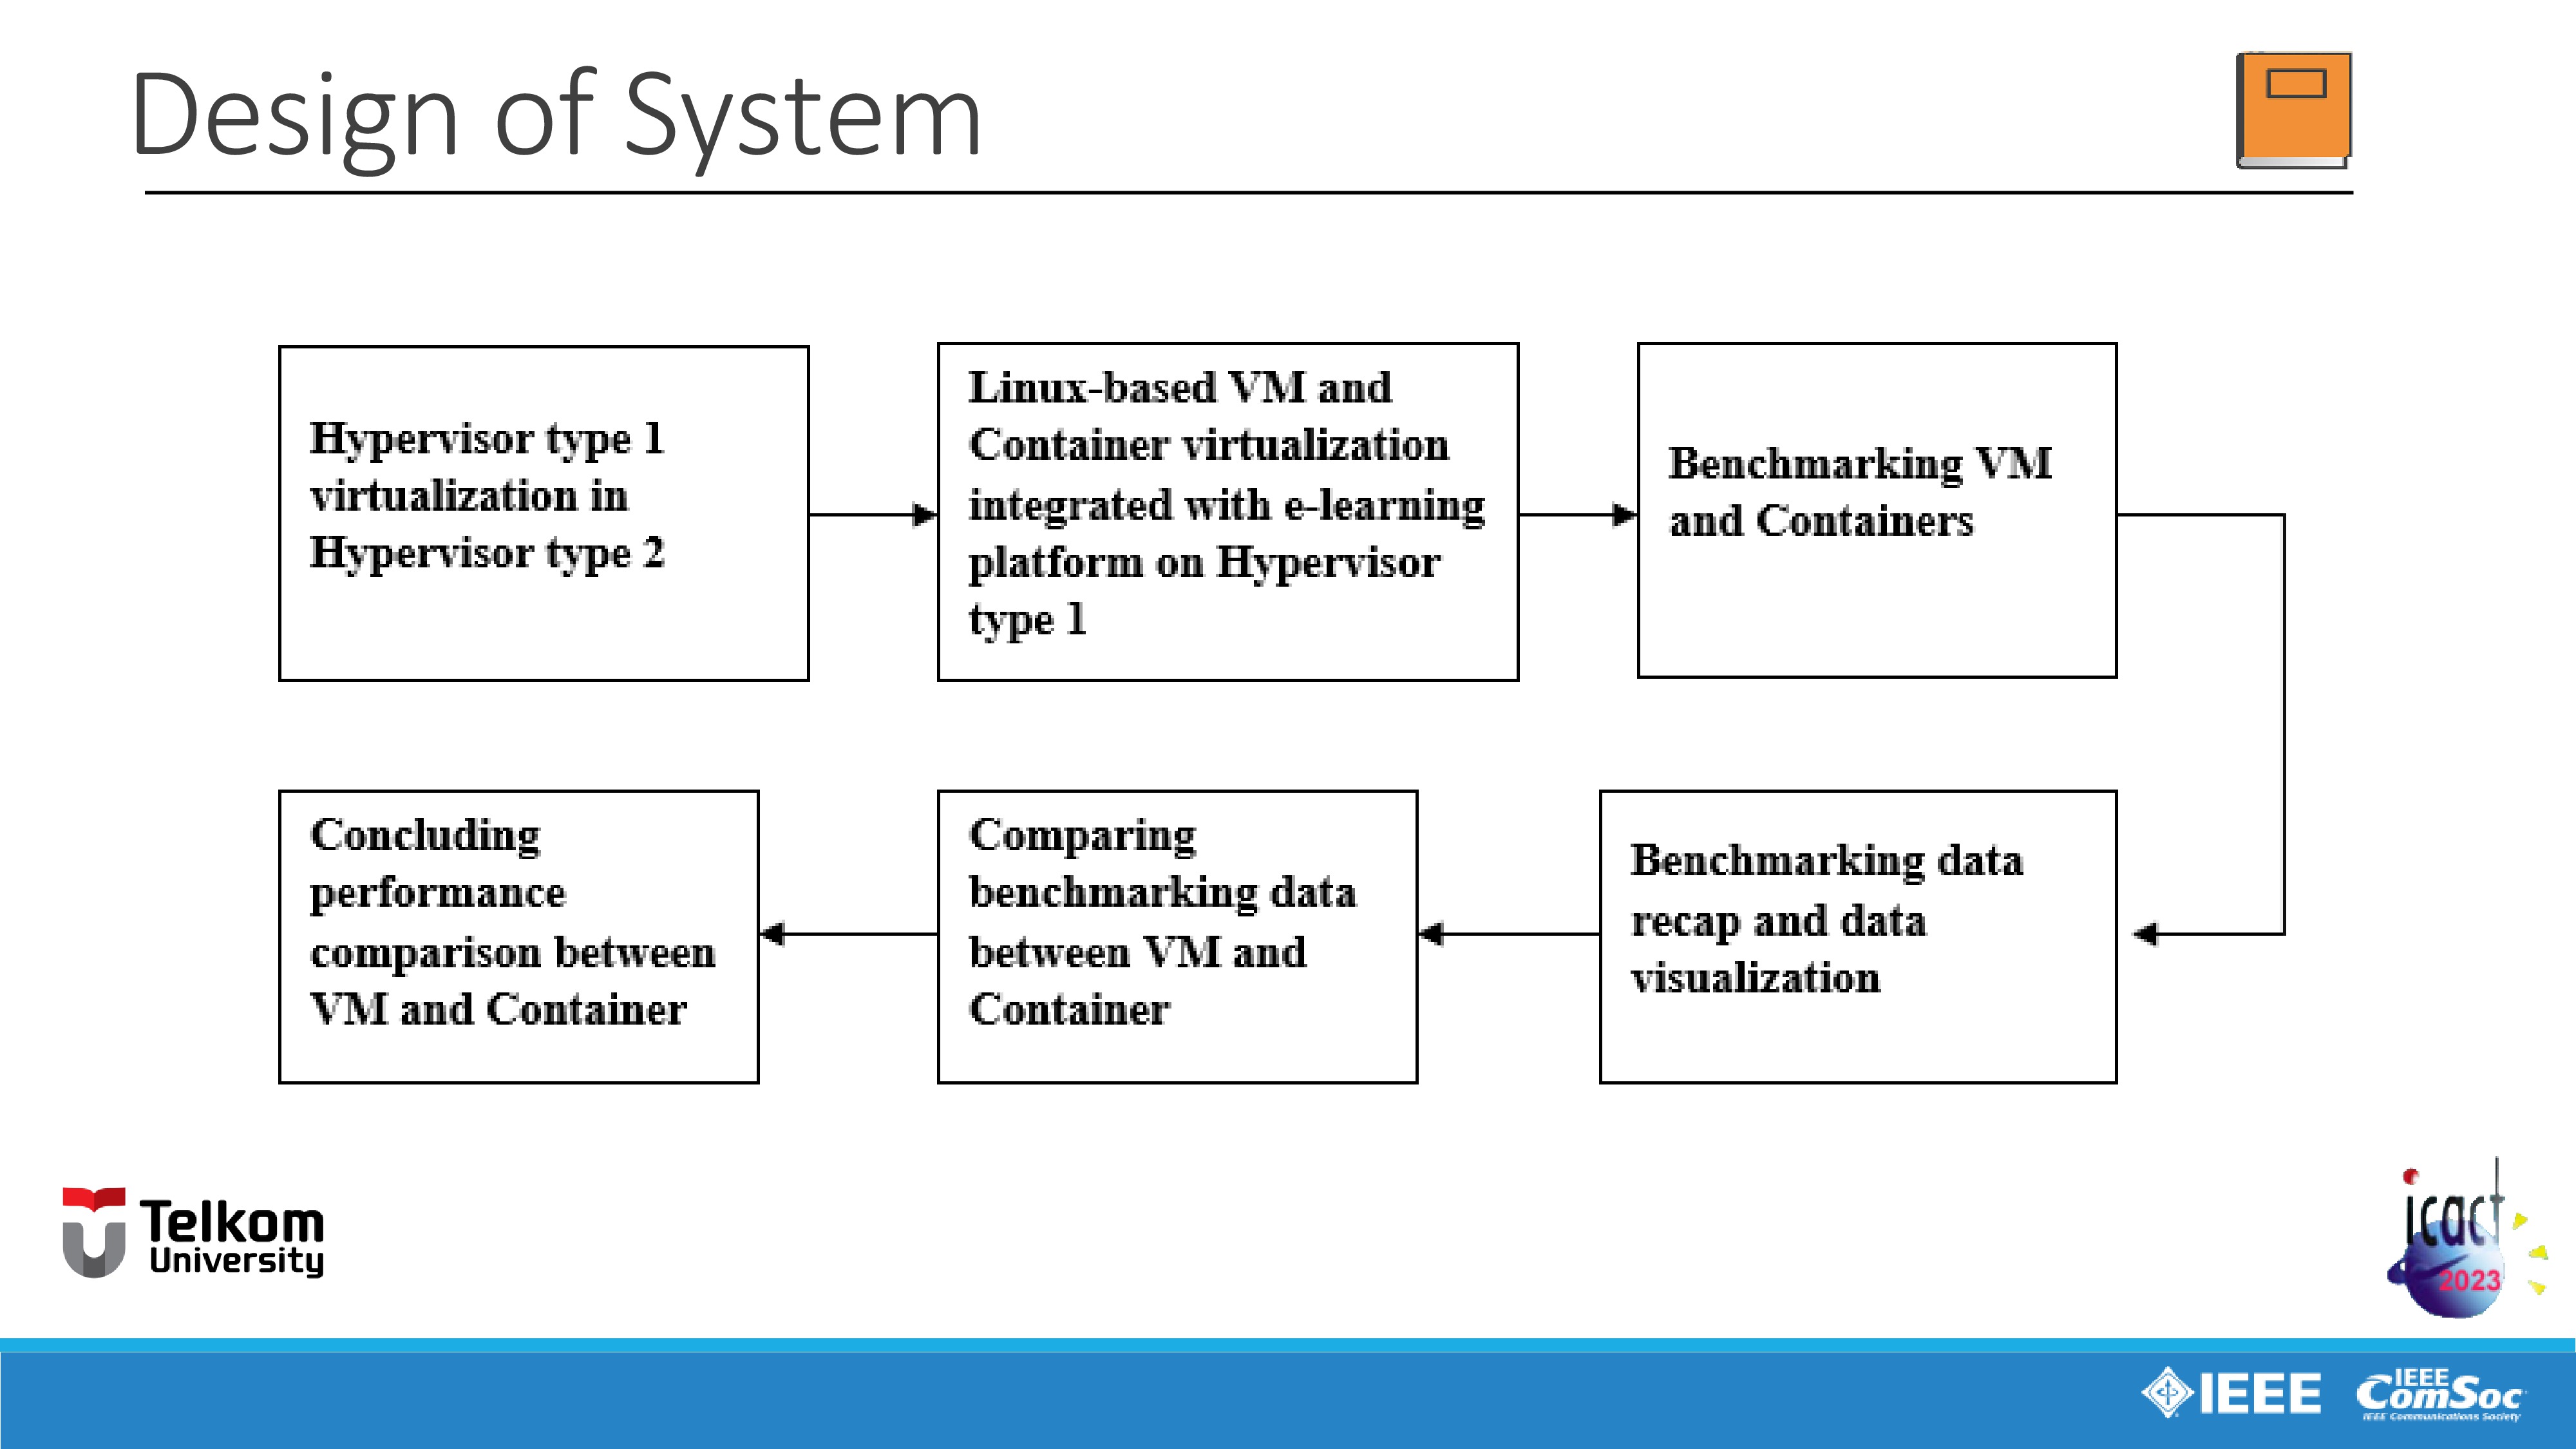 |
As seen in the slide, this is the design of system we use in this study.
First, as explained before, due to hardware limitations because we dont have a switch hardware, Hypervisor type 1 is installed inside the type 2 hypervisor.
And next a Linux-based operating system that already integrated with e-learning platform app is virtualized using both two methods of virtualization, VM and container virtualization inside the type 1 hypervisor.
Next, we're doing the benchmarking session both for VM and container virtualization
And then we collecting the benchmarking session data recap and we also making the visualization of the data recap to make it easier for us to understand and analyze the benchmarking data.
Then from the data visualization, we're comparing the benchmarking data between the VM and container virtualization.
And last, after comparing the benchmarking data between the VM and container virtualization. We're concluding the performance comparison between VM and container virtualization to find which method is better for serving requests for virtual e-learning system.
|
|
ICACT20230068 Slide.13
[Big slide for presentation]
[YouTube] |
Chrome Text-to-Speach Click!! |
 |
Next we moving on to the third part, Design of System.
|
|
ICACT20230068 Slide.12
[Big slide for presentation]
[YouTube] |
Chrome Text-to-Speach Click!! |
 |
Last section of related works is Apache Benchmark. According to the official website of Apache, Apache Benchmark or usually called as 'ab' Linux-based command, is a tool for benchmarking our Apache Hypertext Transfer Protocol (HTTP) server. It is designed to give us an impression of how our current Apache installation performs in a web server. This especially shows us how many requests per second our Apache installation is capable of serving.
Based on that definitions, in this study, we use how many requests are received at the same time that the web server can serve as the main variable.
|
|
ICACT20230068 Slide.11
[Big slide for presentation]
[YouTube] |
Chrome Text-to-Speach Click!! |
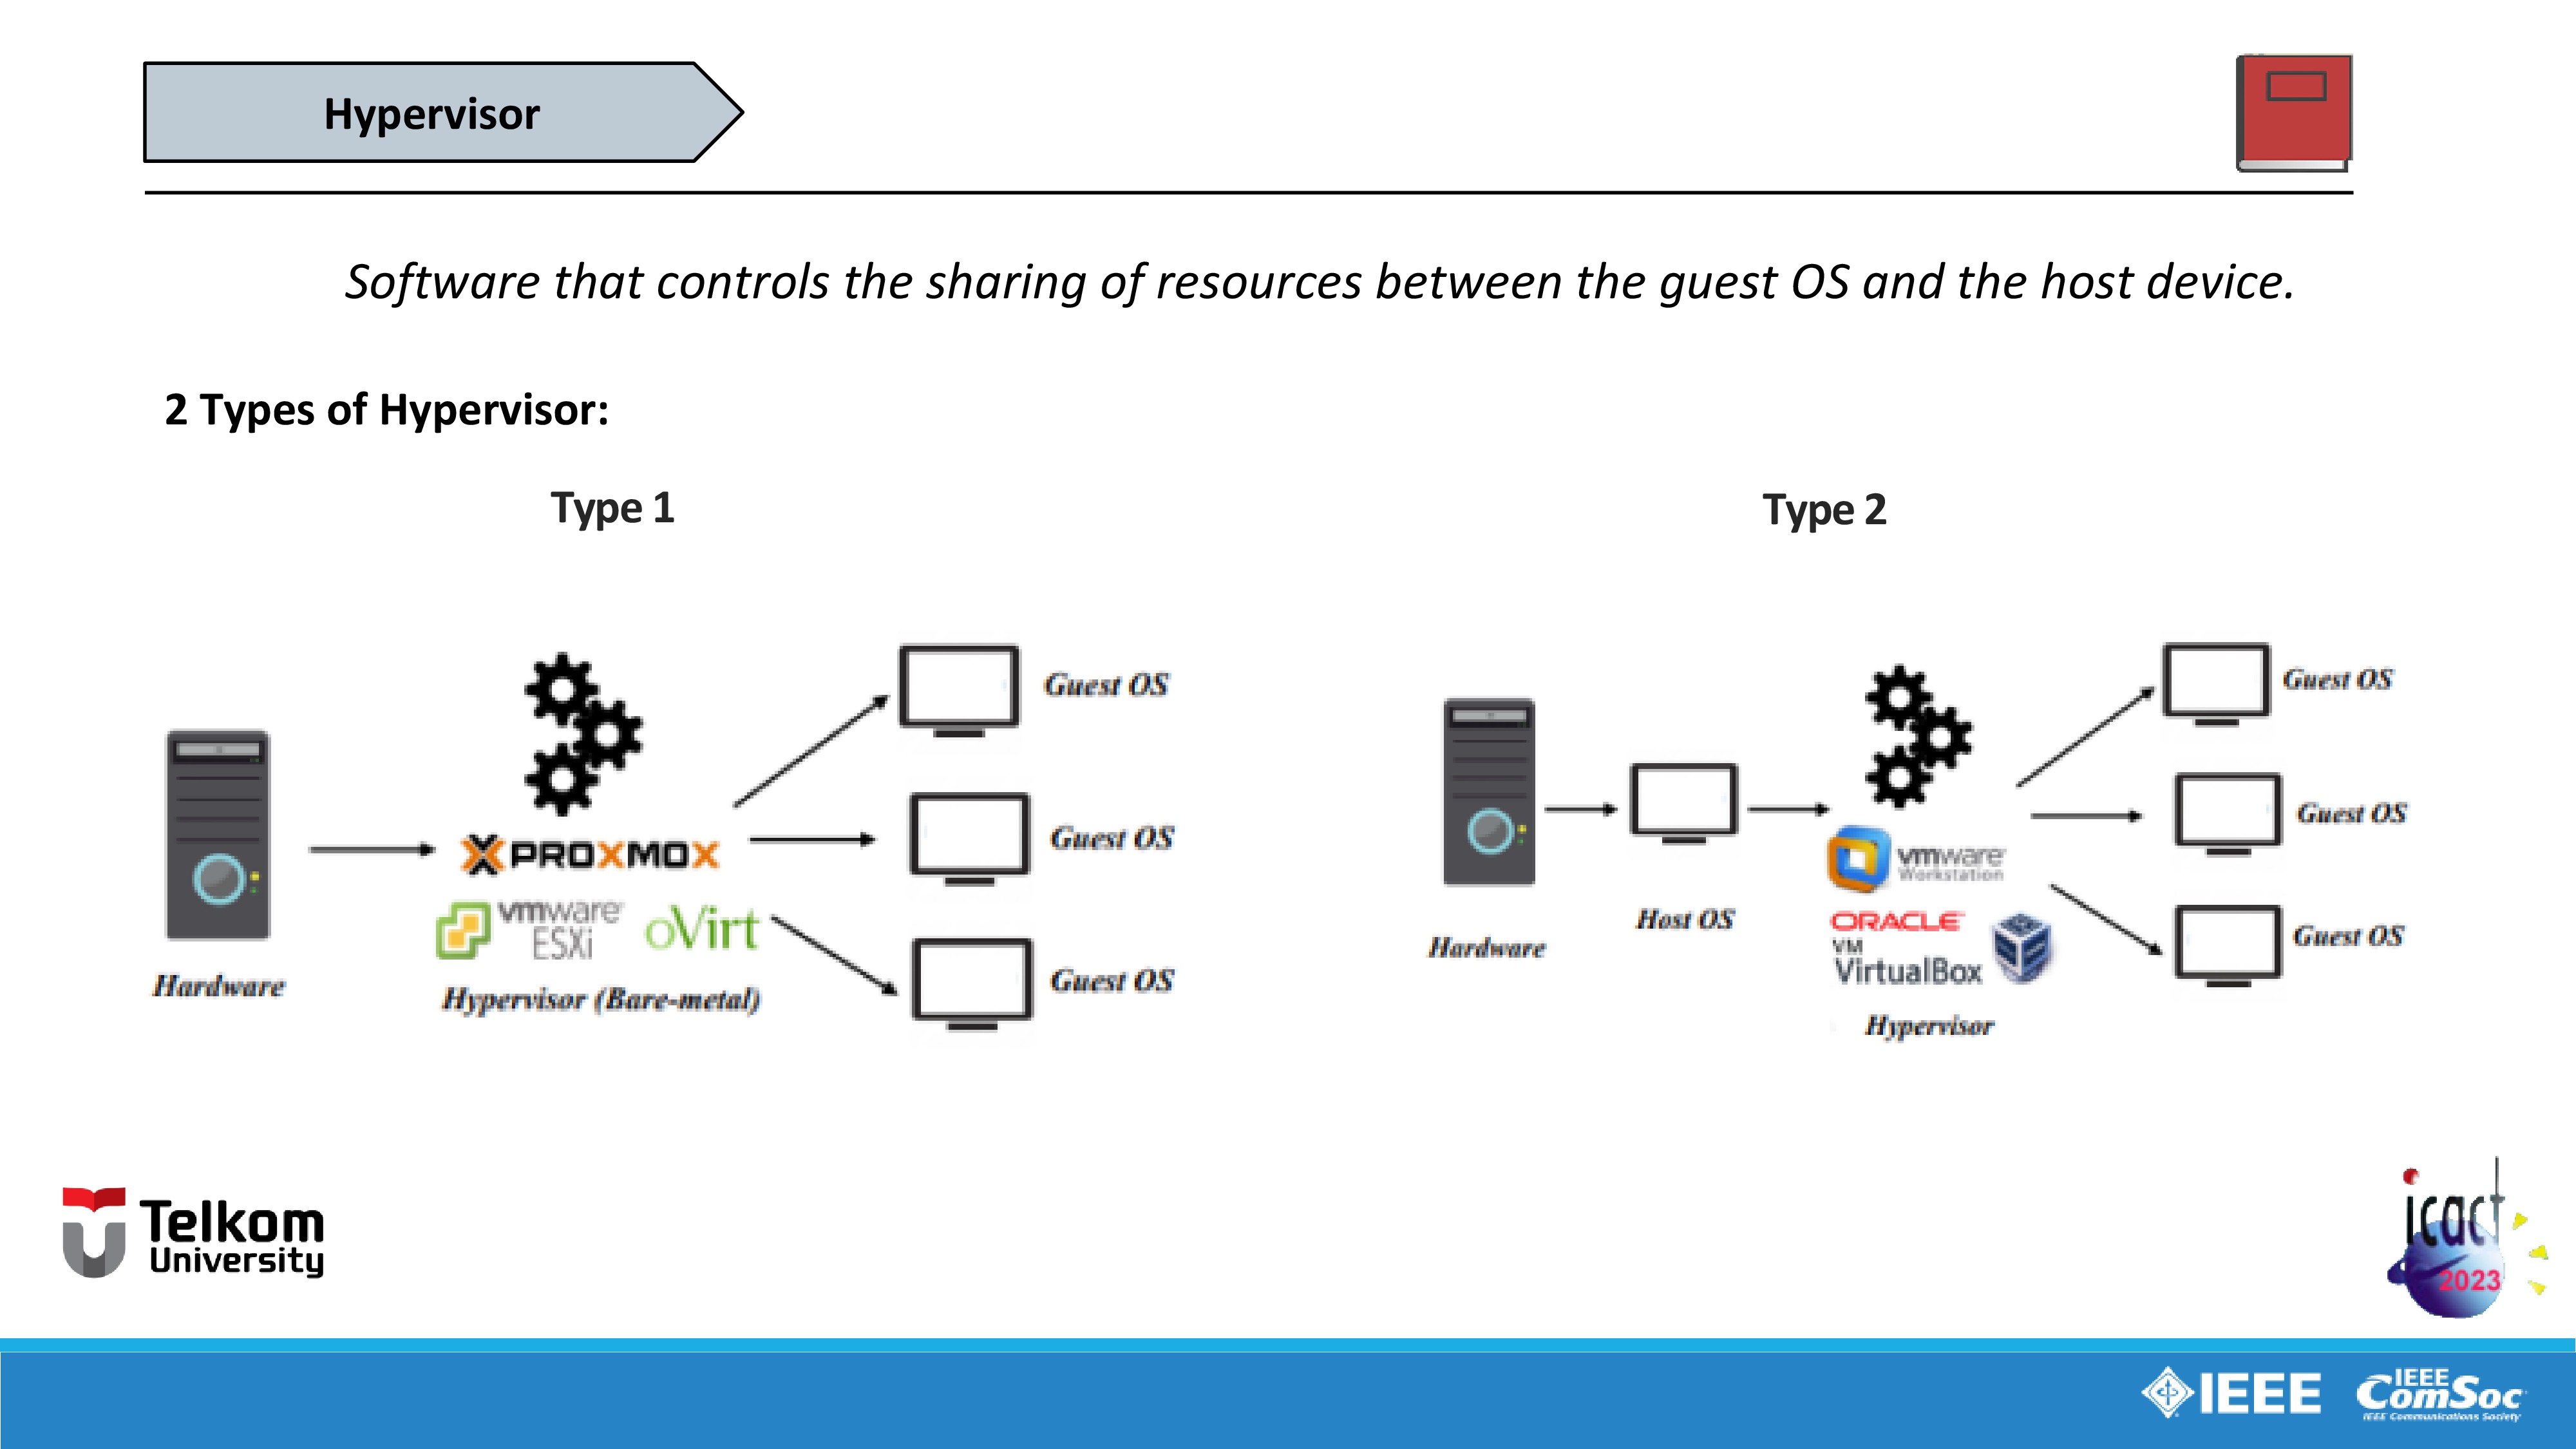 |
Next section is Hypervisor. In short terms, the main principle of hypervisor is to controls the sharing of resources between the guest OS and the host device.
There are two types of hypervisor.
First is Type one hypervisor or usually called bare-metal hypervisor. This type of hypervisor is usually installed directly into switch as a hardware. But in this study, due to hardware limitations, hypervisor type 1 is installed inside the type 2 hypervisor which will be explained with more details in the next part. The examples of type one hypervisor such as Proxmox, VMware ESXi, oVirt, and etc.
And the second is type two hypervisor. This type of hypervisor usually installed in personal computer integrated with host operating system like Microsoft Windows or Linux. The examples of type two hypervisor are VMware Workstation and Oracle VirtualBox.
|
|
ICACT20230068 Slide.10
[Big slide for presentation]
[YouTube] |
Chrome Text-to-Speach Click!! |
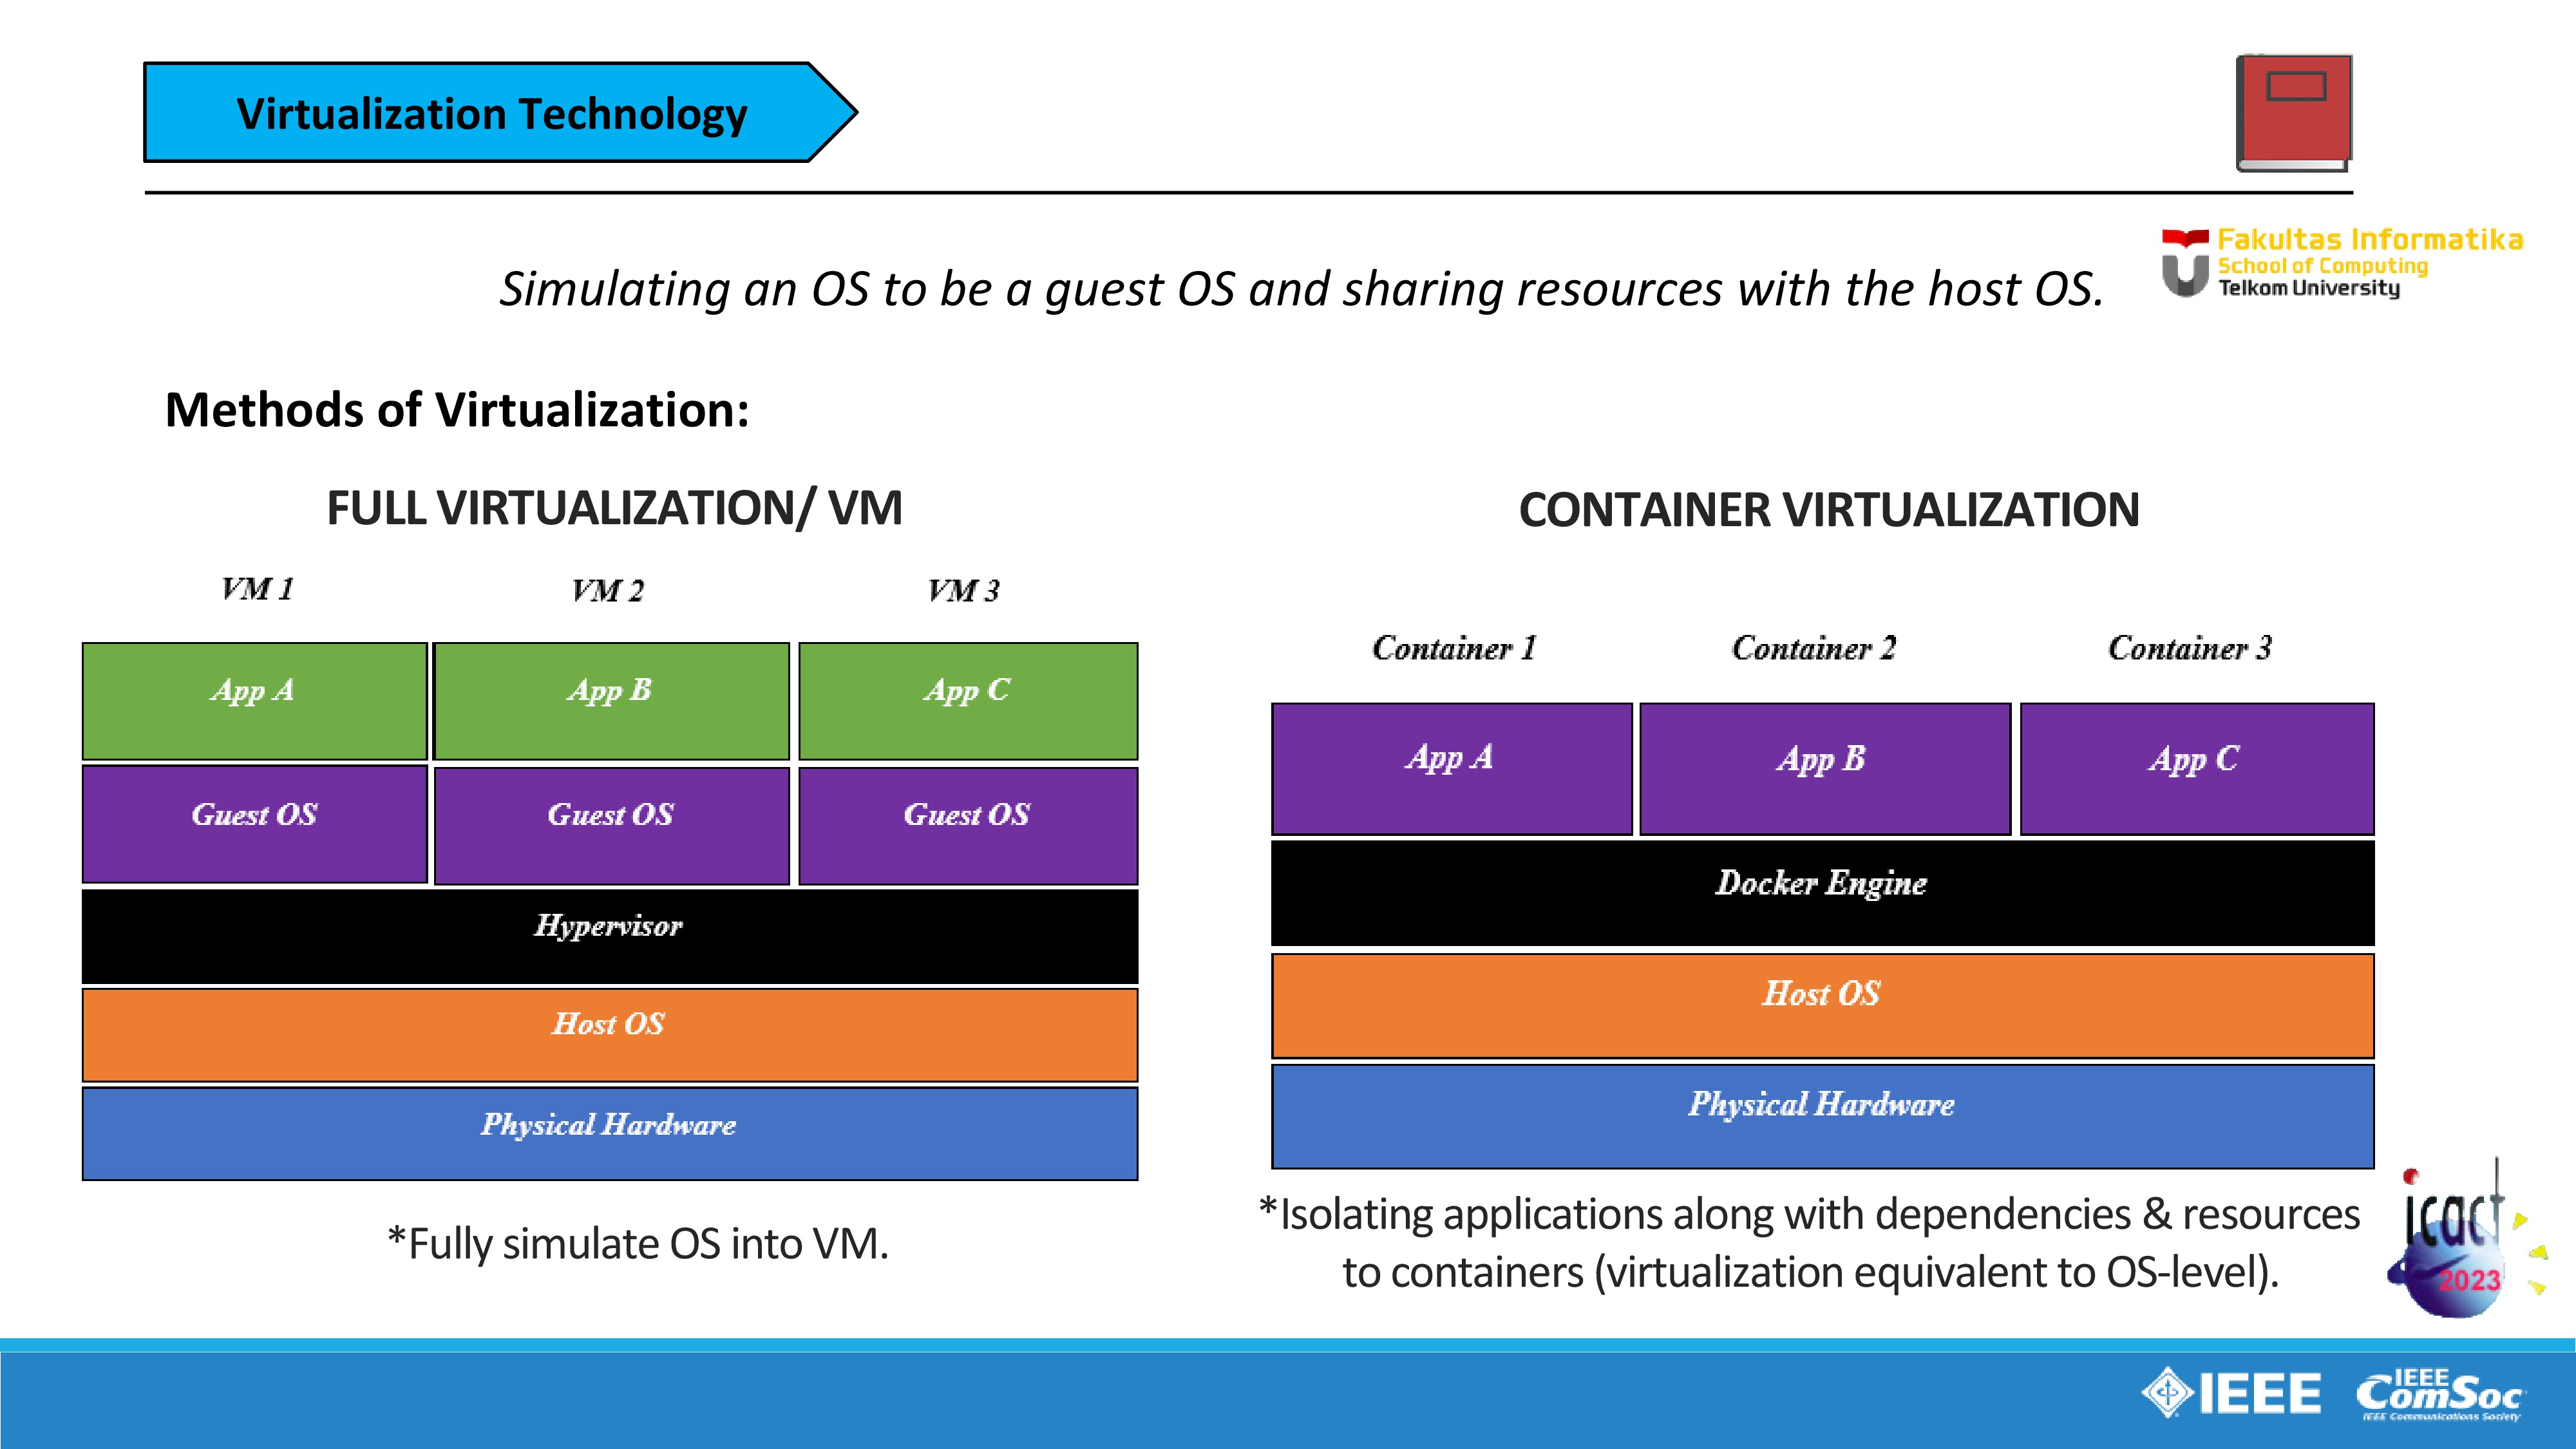 |
Next section is Virtualization Technology, the main principle of virtualization is to simulate an operating system to be the guest operating system and sharing resources such as memory usage, storage, network, and etc. with the host operating system.
There are two methods of virtualization used in this study.
First is full virtualization or virtual machine, contains several layers, first from the bottom is physical hardware such as PC, next layer is the host operating system like Microsoft Windows or Linux, next layer is hypervisor that controls the virtualization of the guest operating system (and will explained with more details in the next slide). Next layer is guest operating system and last layer is the Application such as virtual e-learning platform like Moodle for example.
And the second method is container virtualization, the architecture layers are similar with the VM but the differences is instead of using hypervisor and simulating the guest operating system, this method is using docker engines for controlling the containerization of the applications especially virtual e-learning platform like Moodle for example.
So the main difference of these two methods is between hypervisor and docker engines. Unlike hypervisor, docker engines is Isolating applications along with dependencies & resources to containers and the virtualization is equivalent to OS-level. And According to Docker, a container is a lightweight, stand-alone, executable package of a piece of software that includes everything needed to run it. This means Docker containers are much smaller and require far fewer resources than full virtualization that fully simulates operating system into virtual machine that use more resources.
|
|
ICACT20230068 Slide.09
[Big slide for presentation]
[YouTube] |
Chrome Text-to-Speach Click!! |
 |
Next section is Cloud-based E-Learning Implementation.
Before we moving to Cloud-based E-Learning Implementation, I will explain first about cloud computing. The cloud computing is a computing model that allows on-demand network access to shared computing resources provided by service providers. So the principle of cloud computing is to allow us to access shared computing resources, on-demand, and this means this principle is linked up to ANGKASA project main goal is to make sure educational institutions as users, only need to pay for e-learning service fees according to use (pay-on-demand) as explained before in Introduction part. Thats why we implementing the cloud computing model to virtual e-learning system.
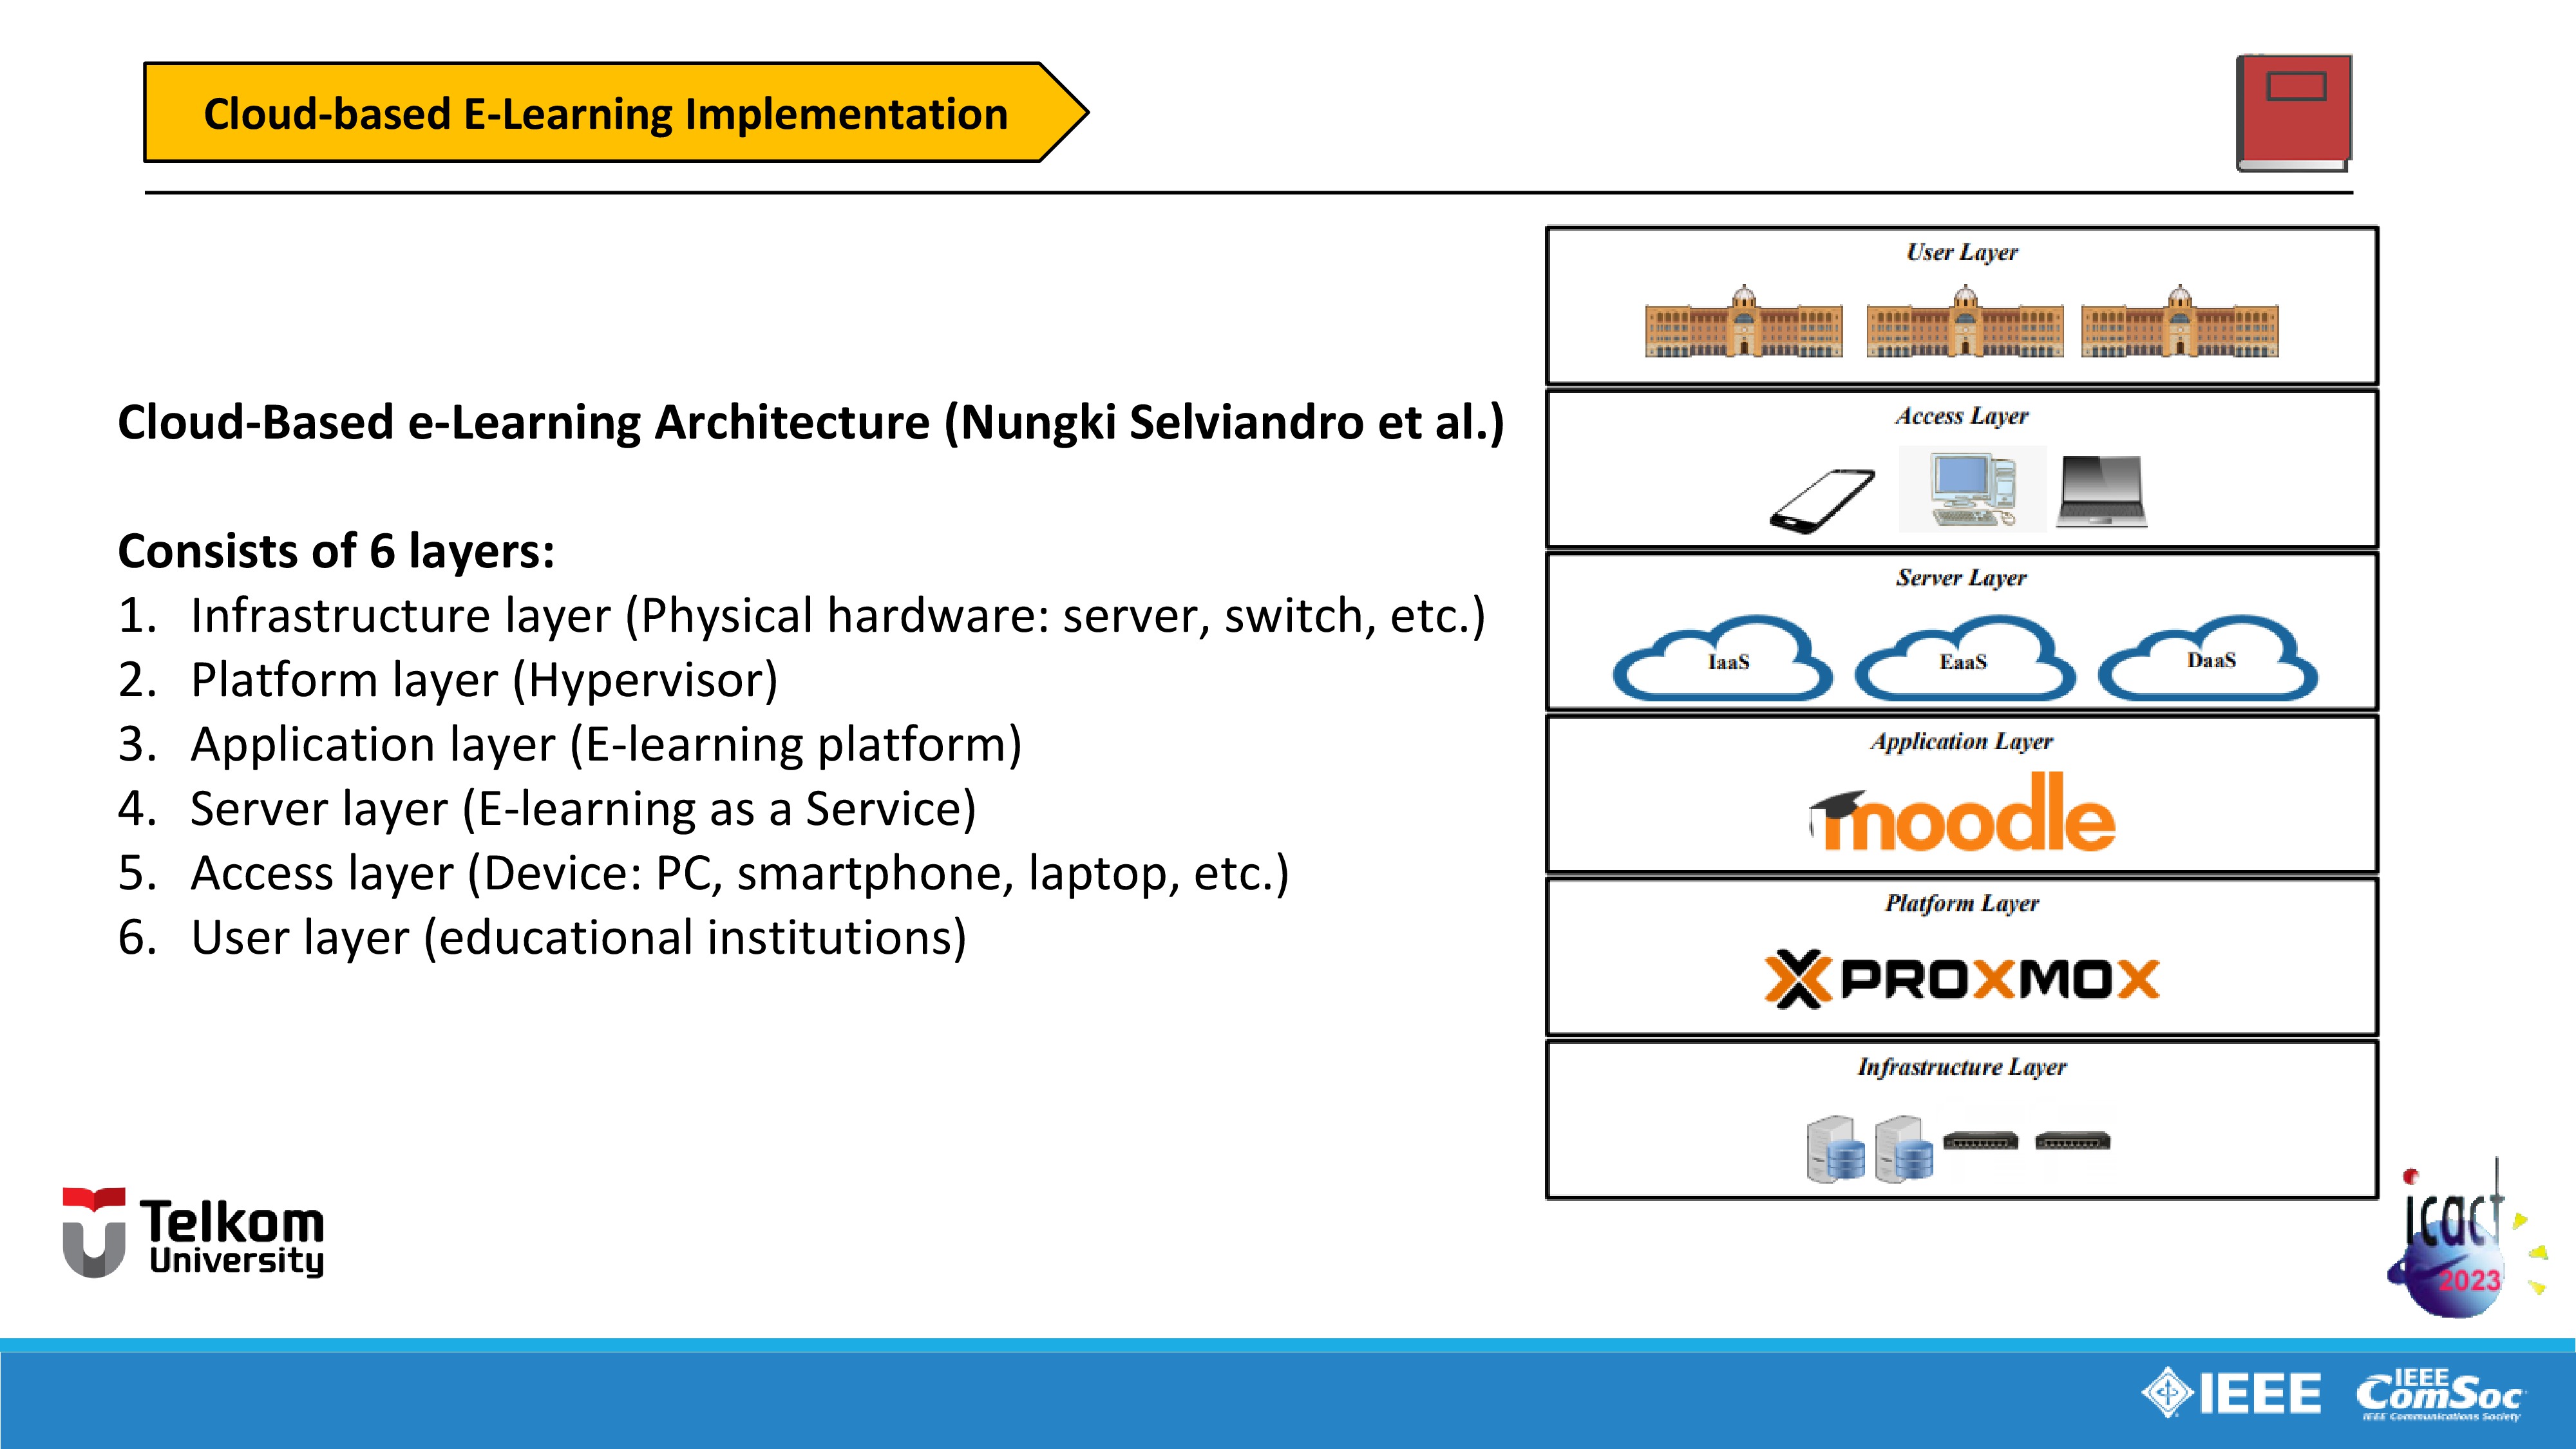
So we moving on to the Cloud-Based e-Learning Architecture used in the study by Nungki Selviandro et al.
This architecture is divided by 6 layers. I will explain it one by one from bottom layer to top layer.
First is Infrastructure layer which consists Physical hardware such as server, switch, etc.
Second is Platform layer consist of Hypervisor like Proxmox Virtual Environment.
Third is Application layer consist of E-learning platform like Moodle, TalentLMS, etc.
Fourth is Server layer contains of E-learning as a Service, Infrastructure as a Service, and Desktop as a Service.
Fifth is Access layer contains of Personal Devices like PC, smartphone, laptop, etc.
And sixth is User layer which contains educational institutions or other institutions as the users.
|
|
ICACT20230068 Slide.08
[Big slide for presentation]
[YouTube] |
Chrome Text-to-Speach Click!! |
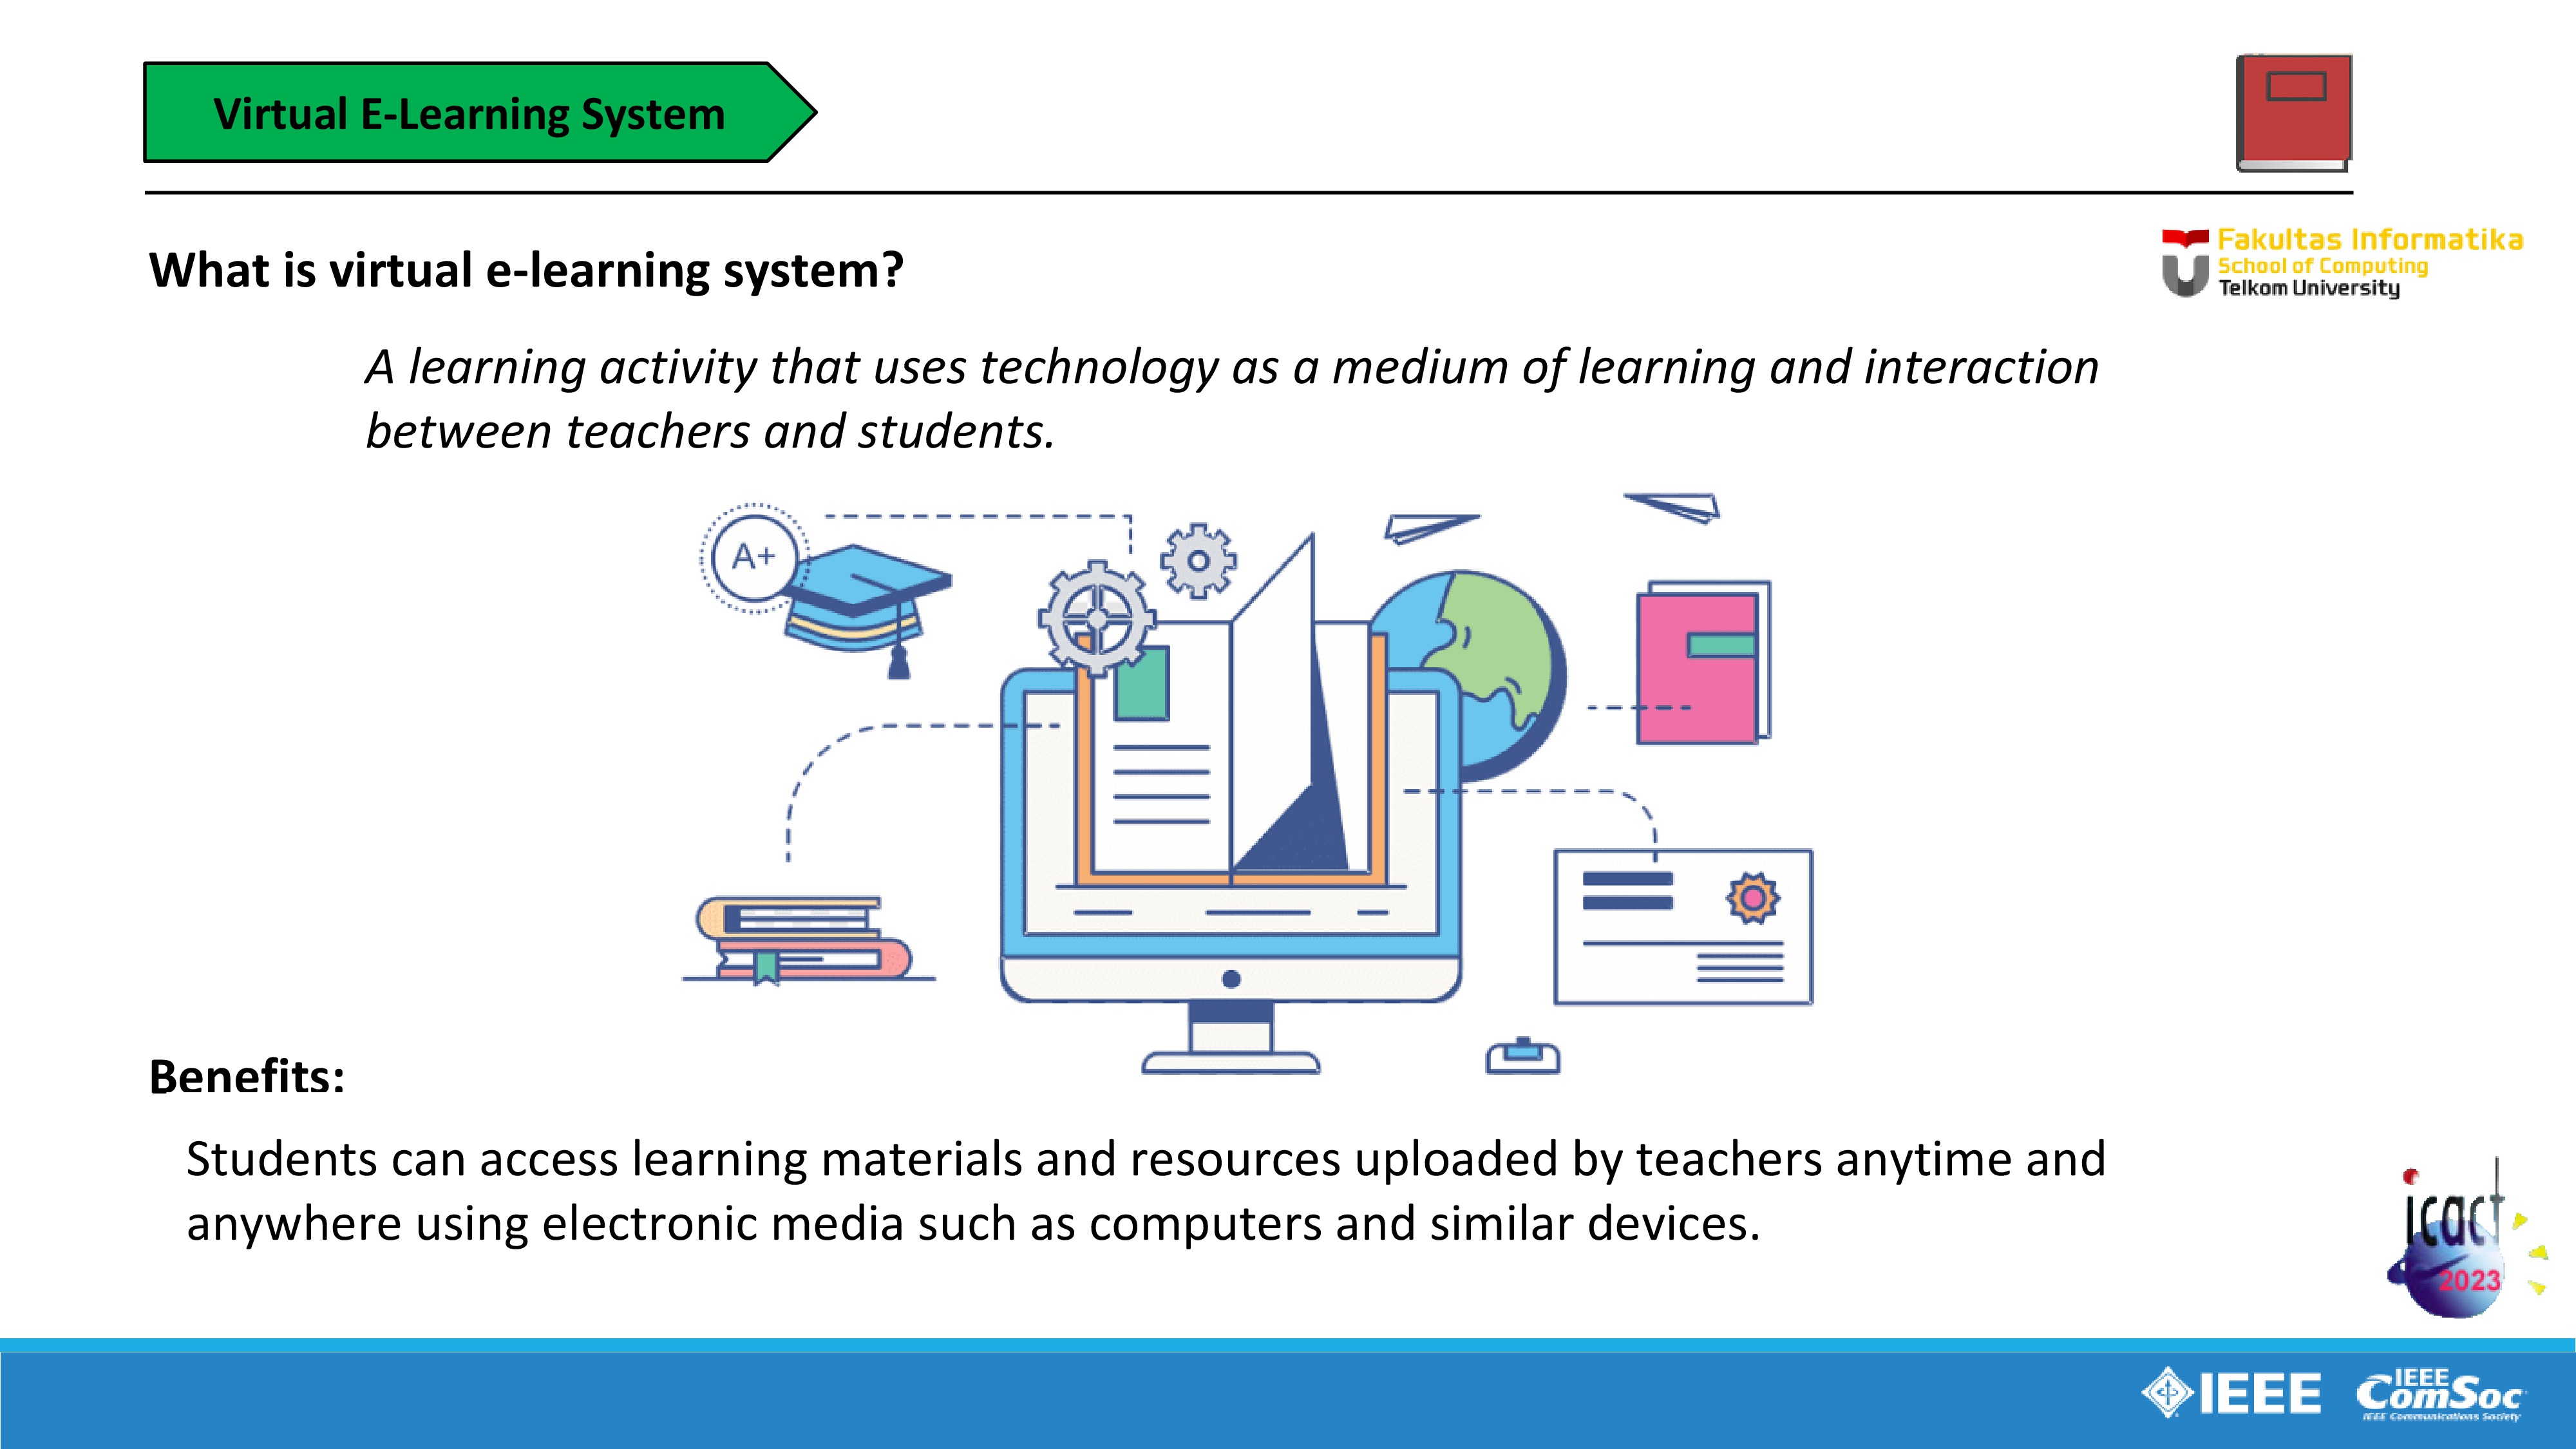 |
First section is Virtual E-learning system.
What is a virtual e-learning system?
In short terms, virtual e-learning system is A learning activity that uses technology as a medium of learning and interaction between teachers and students.
And what the benefits are?
Students can access learning materials such as e-book, presentation slide, explanation videos by teachers, task, quiz, etc. uploaded by teachers anytime and anywhere using electronic media such as computers and similar devices.
|
|
ICACT20230068 Slide.07
[Big slide for presentation]
[YouTube] |
Chrome Text-to-Speach Click!! |
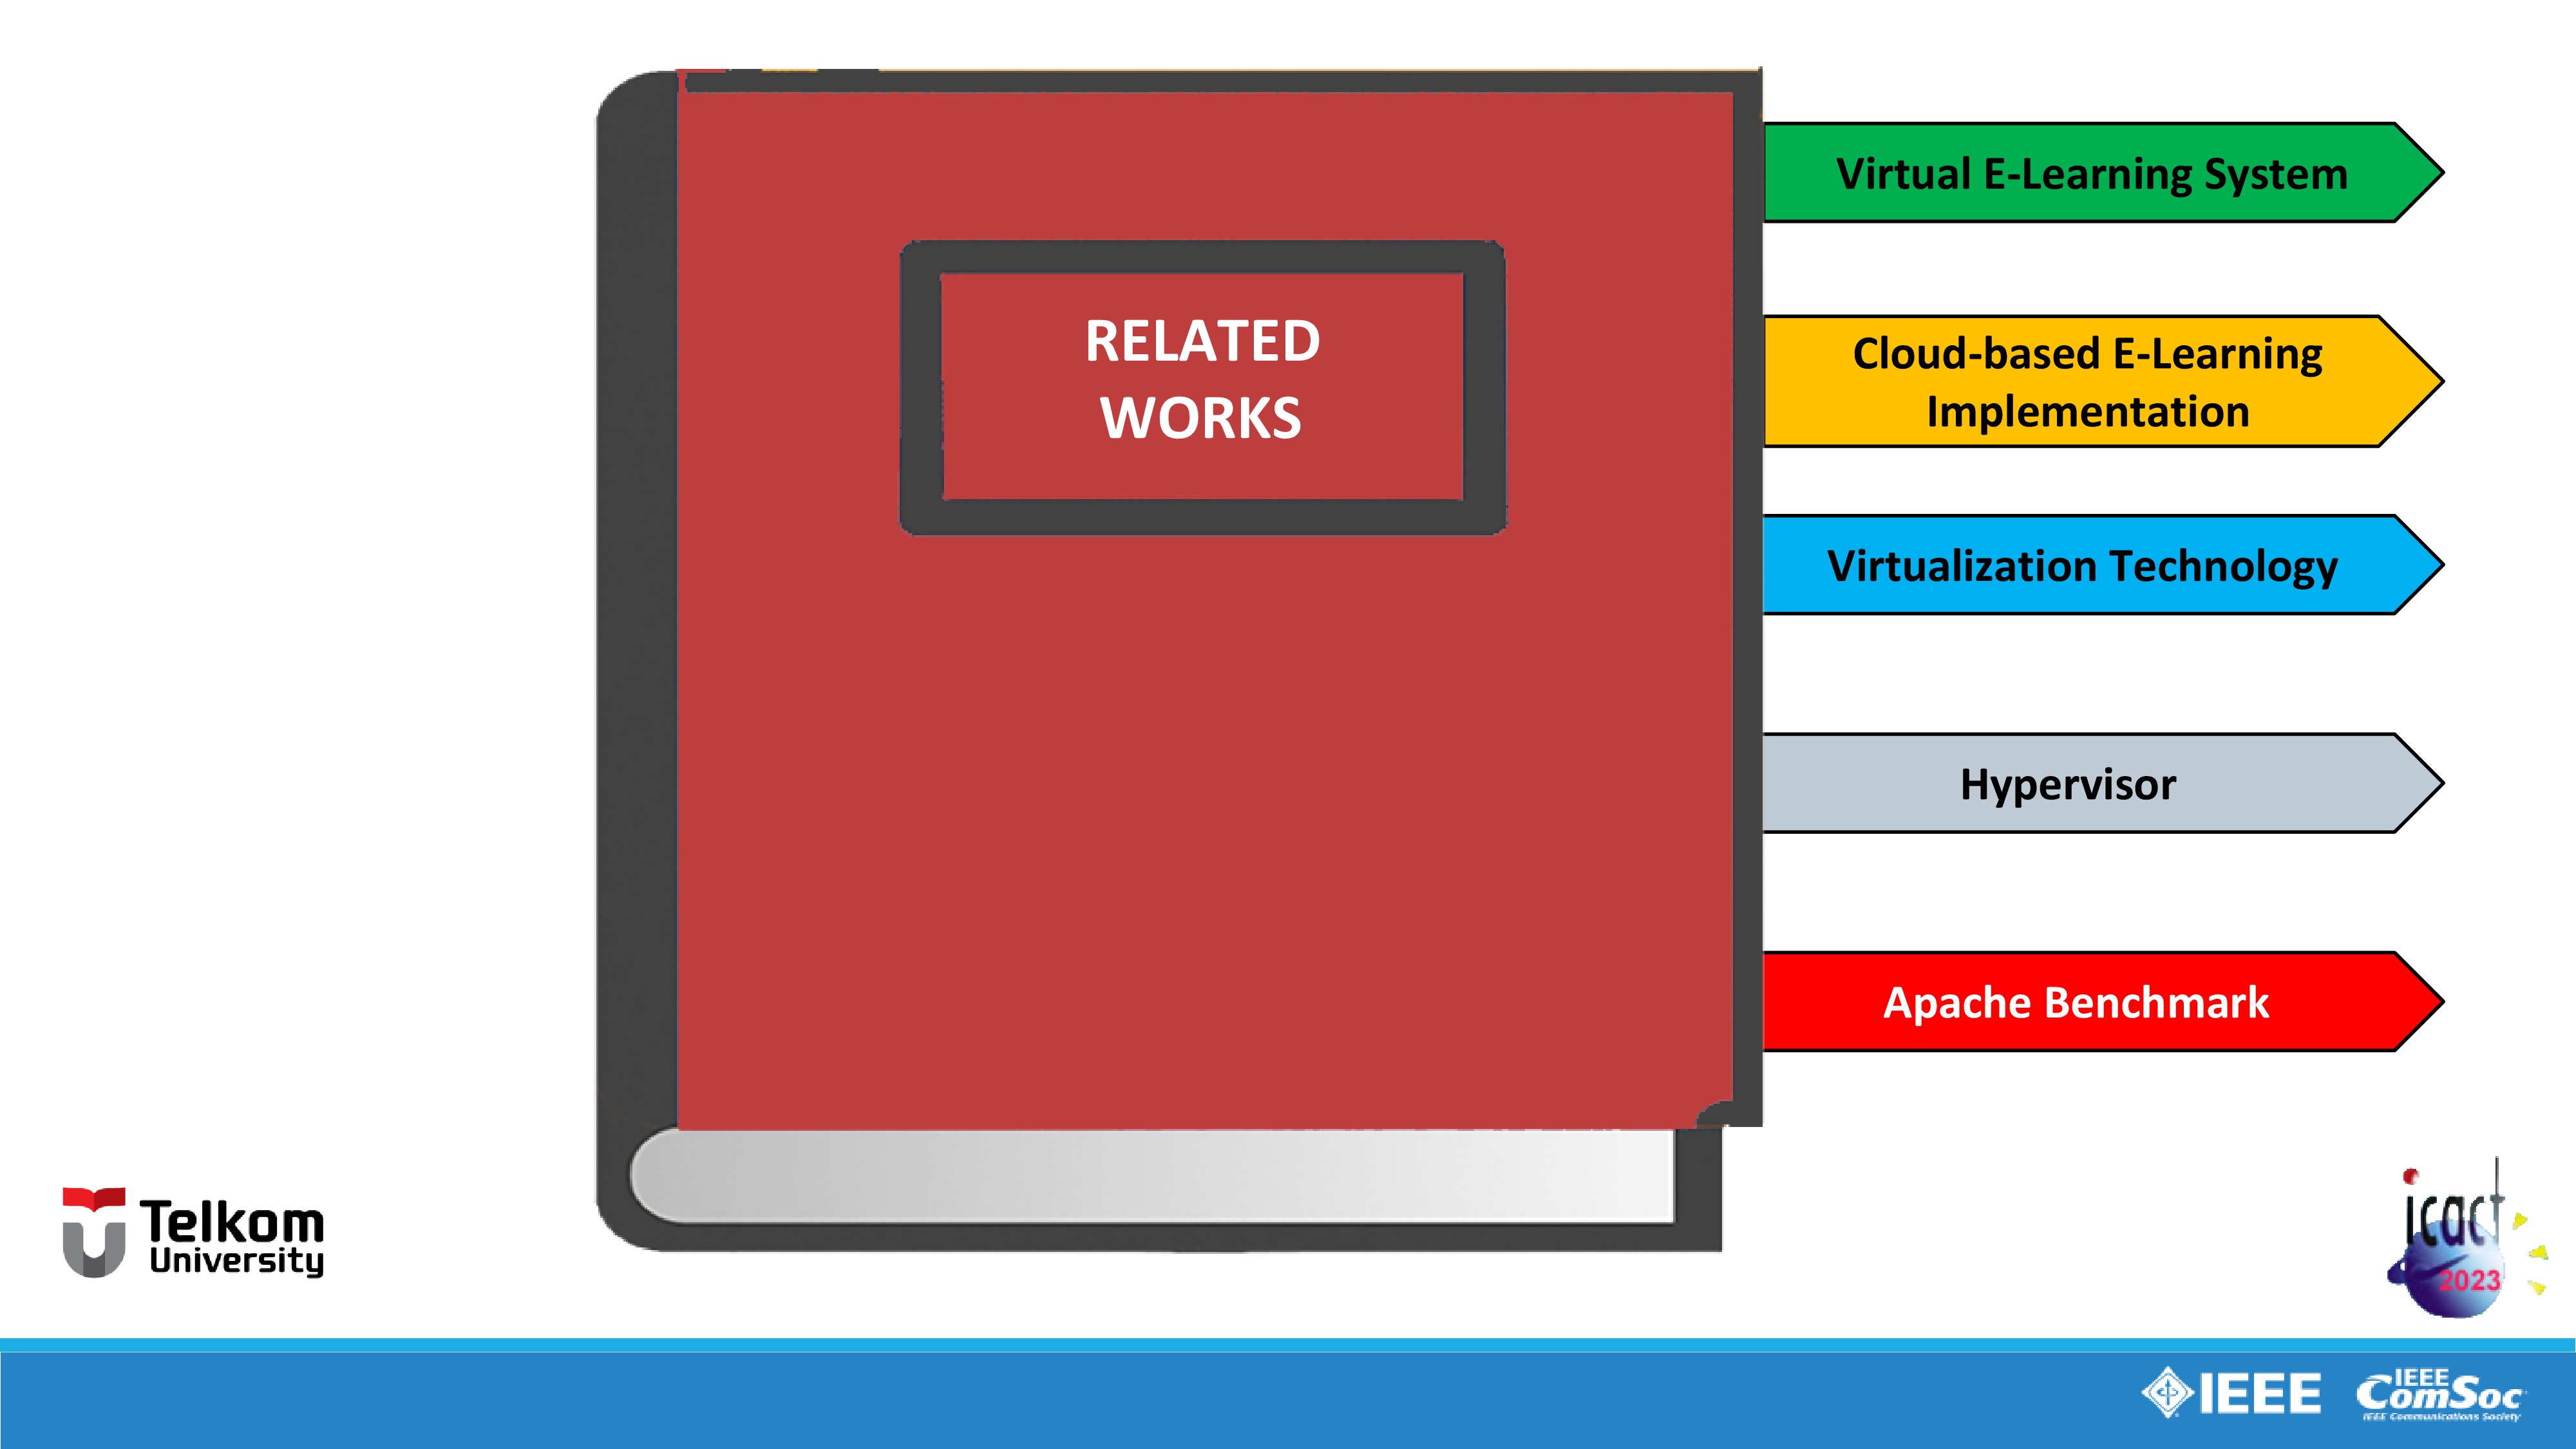 |
We moving on to the second part, Related Works, in this part I will explain all literatures used for this study. This part is divided by five sections: Introduction, Related Works, Design of System, Experiment and Result, Conclusion and Future Works.
|
|
ICACT20230068 Slide.06
[Big slide for presentation]
[YouTube] |
Chrome Text-to-Speach Click!! |
 |
And now, I will explain the objective in this study.
First, We aim to do a performance analysis research of cloud-based virtual e-learning system used in ANGKASA project by using the virtualization technology with two virtualization method, VM or full virtualization method and container virtualization.
And our main objective is to compare these two virtualization method for finding which one is the best virtualization method in terms of performance using Apache Benchmarking tool to determine which method of virtualization is better for cloud-based virtual e-learning system.
|
|
ICACT20230068 Slide.05
[Big slide for presentation]
[YouTube] |
Chrome Text-to-Speach Click!! |
 |
In order to solve these problems, in our study, we need to do a performance analysis research of cloud-based virtual e-learning system used in ANGKASA project and the main goal is to find the best virtualization method for virtual e-learning system implemented with cloud computing technology to help educational institutions to be able to have and use their own virtual e-learning system.
|
|
ICACT20230068 Slide.04
[Big slide for presentation]
[YouTube] |
Chrome Text-to-Speach Click!! |
 |
So a project was initiated called ANGKASA project, ANGKASA project is a virtual e-learning system provider and this project is aimed to help educational institutions to have their own cloud-based e-learning system with less cost, time, and skills to develop it especially in terms of cost, they also will have benefit that they only need to pay for e-learning service fees according to use (pay-on-demand).
|
|
ICACT20230068 Slide.03
[Big slide for presentation]
[YouTube] |
Chrome Text-to-Speach Click!! |
 |
First, I will explain about Background and Motivation.
As we know in this pandemic era, there are many educational institutions such as school, university, etc. are unable to organize face-to-face learning activities session. So virtual e-learning system is the most effective solutions for this problem. However, to be able to develop a virtual e-learning system, they must have at least specialized technicians to develop, manage, and maintenance the virtual e-learning system.
From this situations, there are many problems began to arise especially in terms of costs, a big amount of budget is needed for buying infrastructure such as server, human resources for hiring specialized technicians and expertise for managing the virtual e-learning system.
|
|
ICACT20230068 Slide.02
[Big slide for presentation]
[YouTube] |
Chrome Text-to-Speach Click!! |
 |
We moving on to the first part, Introduction.
|
|
ICACT20230068 Slide.01
[Big slide for presentation]
[YouTube] |
Chrome Text-to-Speach Click!! |
 |
So this is the outline for our presentation, divided by five parts. Introduction, Related Works, Design of System, Experiment and Result, Conclusion and Future Works.
|
|
ICACT20230068 Slide.00
[Big slide for presentation]
[YouTube] |
Chrome Text-to-Speach Click!! |
 |
Greetings everyone, my name is Stevan Del Arisandi, I am an Informatics Student from Telkom University, Bandung, Indonesia. In this session, I will be the presenter for our paper titled Performance Analysis of Virtual Learning System: A Case Study of ANGKASA. The authors are myself Stevan Del Arisandi, and my supervisors Mr. Nungki Selviandro, Ms. Kusuma Ayu Laksitowening, and Mr. Dana Sulistyo Kusumo.
|