ICACT20230270 Slide.00
[Big Slide]
[YouTube] ICACT20230270 Slide.00
[Big Slide]
[YouTube] |
Chrome  Click!! Click!! |
 |
Fuzzy PID Controlled Temperature in Phototherapy Incubator for Infant Jaundice Treatment: A Simulation�
Juhui He*, Xing Wen*, Jiiapei Cai*,
Bing-Yuh Lu*, Hongjie Zheng*, Xiaokang Cheng*, Yiheng Chen*
* Guangdong University of Petrochemical Technology, Maoming City, Guangdong, China
franklinlu888@outlook.com
|
| ICACT20230270 Slide.01
[Big Slide]
|
Chrome Click!! |
 |
Introduction�
Neonatal jaundice
Phototherapy incubator
Fuzzy PID (FPID) control
|
| ICACT20230270 Slide.02
[Big Slide]
|
Chrome Click!! |
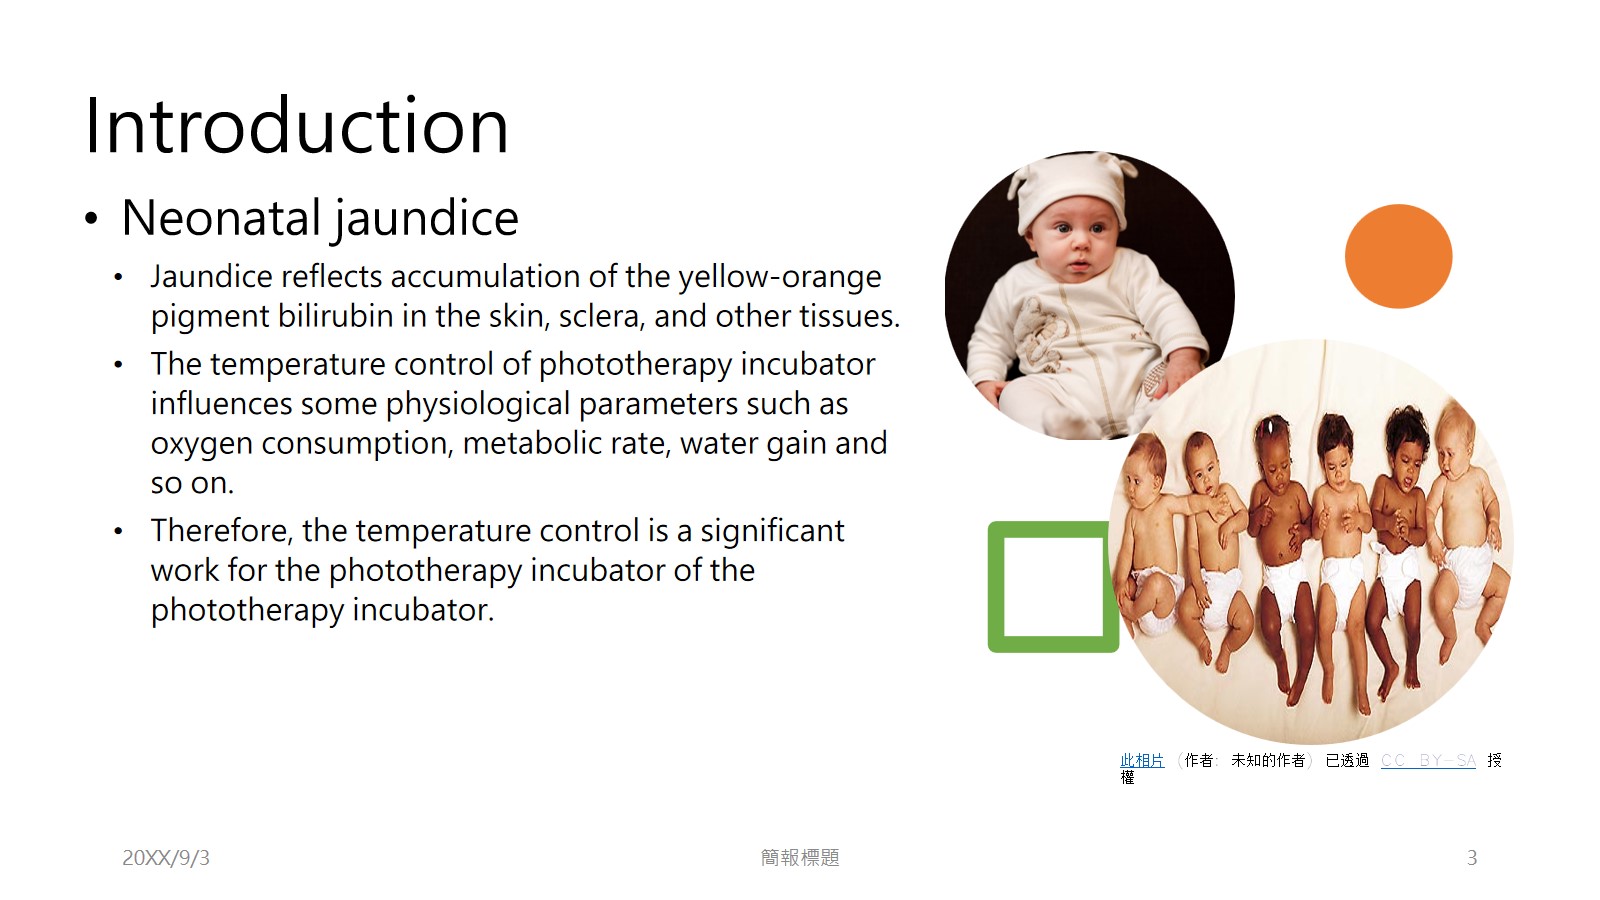 |
Introduction
Neonatal jaundice
Jaundice reflects accumulation of the yellow-orange pigment bilirubin in the skin, sclera, and other tissues.
The temperature control of phototherapy incubator influences some physiological parameters such as oxygen consumption, metabolic rate, water gain and so on.
Therefore, the temperature control is a significant work for the phototherapy incubator of the phototherapy incubator.
|
| ICACT20230270 Slide.03
[Big Slide]
|
Chrome Click!! |
 |
Introduction
Classical proportional-integral-derivative (PID) controller, a very popular controller in industries, presents a good performance by the proportional, integrative, and differential operations of the error between setpoint value and feedback output value [3].
Fuzzy logic was firstly suggested by Lotfi Zadeh in 1965 [9]. He introduces the concept of “linguistic variables”, which was defined as the fuzzy set to be the interference rules of the controller [10-12].
The traditional phototherapy incubator does not conclude the temperature control. The temperature in the phototherapy incubator is depended on the room temperature under control of air conditioner or heat radiator.
|
| ICACT20230270 Slide.04
[Big Slide]
|
Chrome Click!! |
 |
Methods�
System structure
Transfer equation
FIS
PID control
Parameter settings
Equipment
|
| ICACT20230270 Slide.05
[Big Slide]
|
Chrome Click!! |
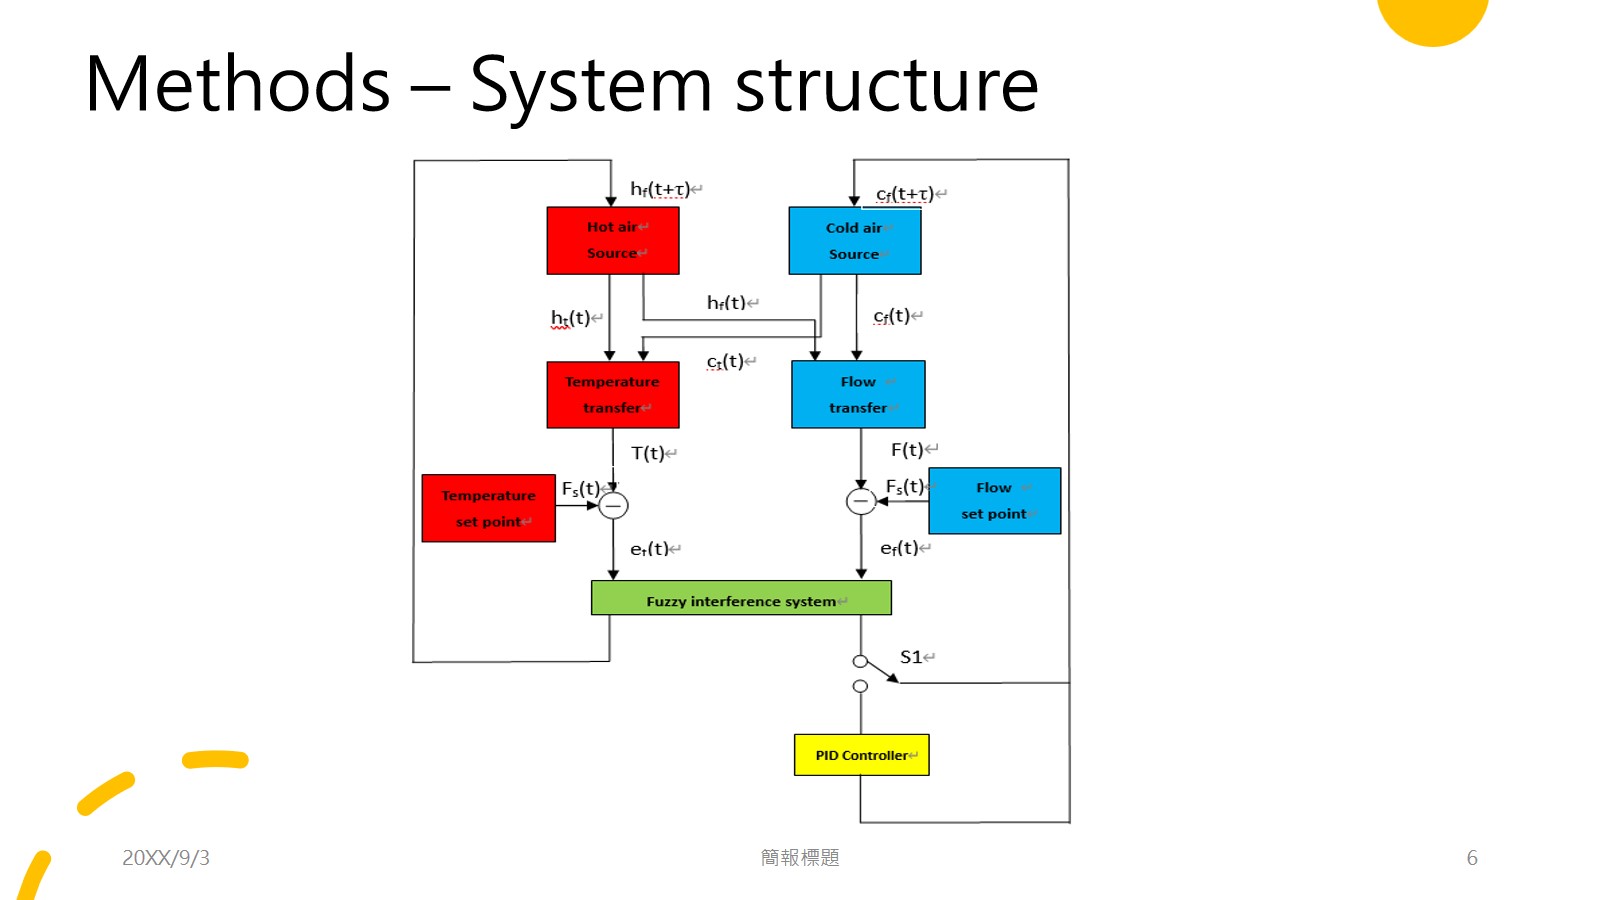 |
The system block diagram is presented in Fig. 1 which displayed the 2 modes of the controller. One is PID controller, the other is FPID. The modes can be alternated by the switch (S1). There were 2 air flow sources input the phototherapy incubator to adjust the temperature. The hot air flow source output higher temperature air (ht(t)) with the flow speed of hf(t) where t denoted as time. The cold air flow source output lower temperature air (ct(t)) with the flow speed of cf(t). The ht(t) and ct(t) input the temperature transfer block and output sensing temperature, i.e. T(t) as well as hf(t) and cf(t) input the flow transfer block and output sensing flow, i.e. F(t). The temperature and flow setpoints were Ts(t) and Fs(t), respectively. Therefore, in the fussy control mode, we have the errors of temperature (et(t)) and flow (ef(t)), then the errors input the fuzzy interference system (FIS) to compute the next output flows of air sources, i.e. hf(t+τ), and cf(t+τ) where τ is the one step duration of time. If the S1 connected with PID controller, the control mode changed to FPID for computing the next flow cf(t+τ). |
| ICACT20230270 Slide.06
[Big Slide]
|
Chrome Click!! |
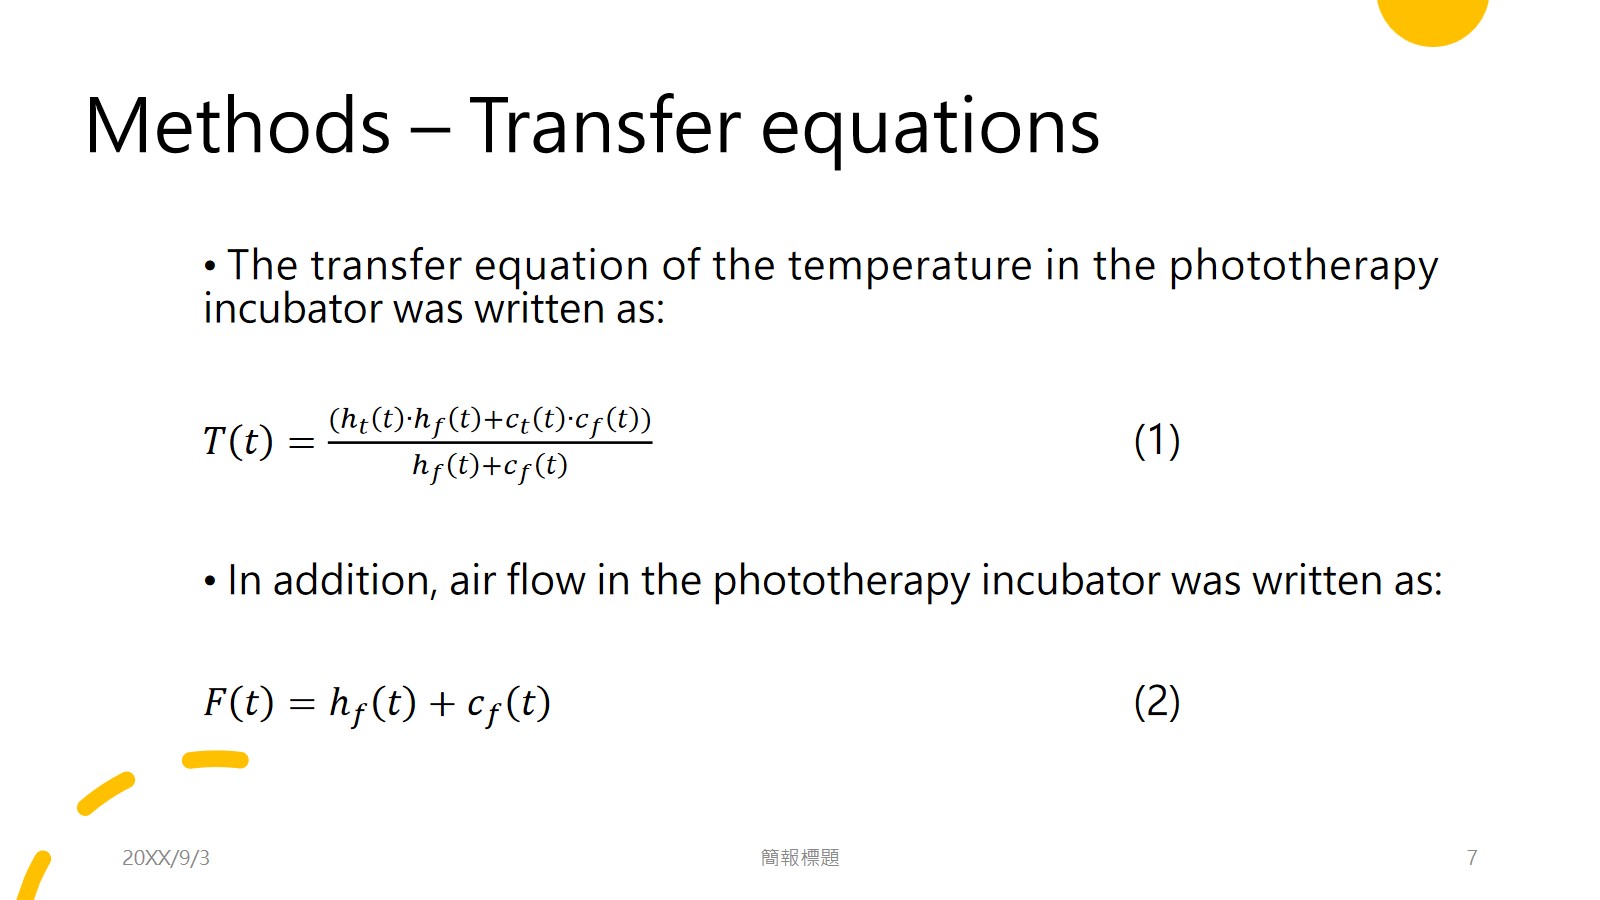 |
Methods – Transfer equations
The transfer equation of the temperature in the phototherapy incubator was written as:
𝑇(𝑡)=((ℎ_𝑡 (𝑡)∙ℎ_𝑓 (𝑡)+𝑐_𝑡 (𝑡)∙𝑐_𝑓 (𝑡)))/(ℎ_𝑓 (𝑡)+𝑐_𝑓 (𝑡) ) (1)
In addition, air flow in the phototherapy incubator was written as:
𝐹(𝑡)=ℎ_𝑓 (𝑡)+𝑐_𝑓 (𝑡) (2)
|
| ICACT20230270 Slide.07
[Big Slide]
|
Chrome Click!! |
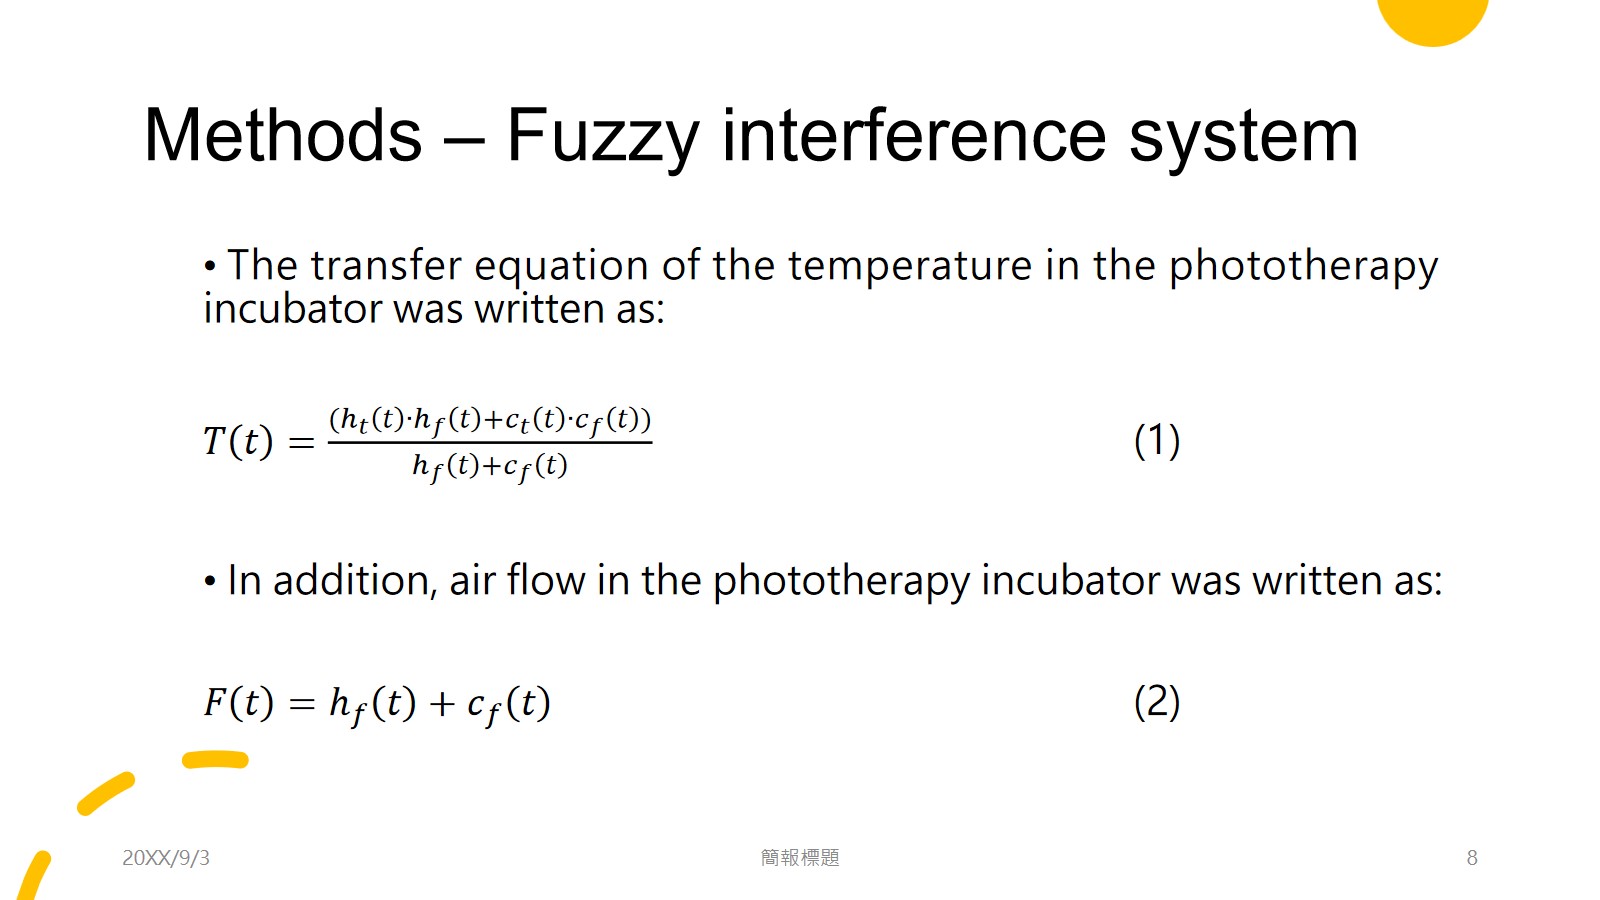 |
Methods – Fuzzy interference system
The transfer equation of the temperature in the phototherapy incubator was written as:
𝑇(𝑡)=((ℎ_𝑡 (𝑡)∙ℎ_𝑓 (𝑡)+𝑐_𝑡 (𝑡)∙𝑐_𝑓 (𝑡)))/(ℎ_𝑓 (𝑡)+𝑐_𝑓 (𝑡) ) (1)
In addition, air flow in the phototherapy incubator was written as:
𝐹(𝑡)=ℎ_𝑓 (𝑡)+𝑐_𝑓 (𝑡) (2)
|
| ICACT20230270 Slide.08
[Big Slide]
|
Chrome Click!! |
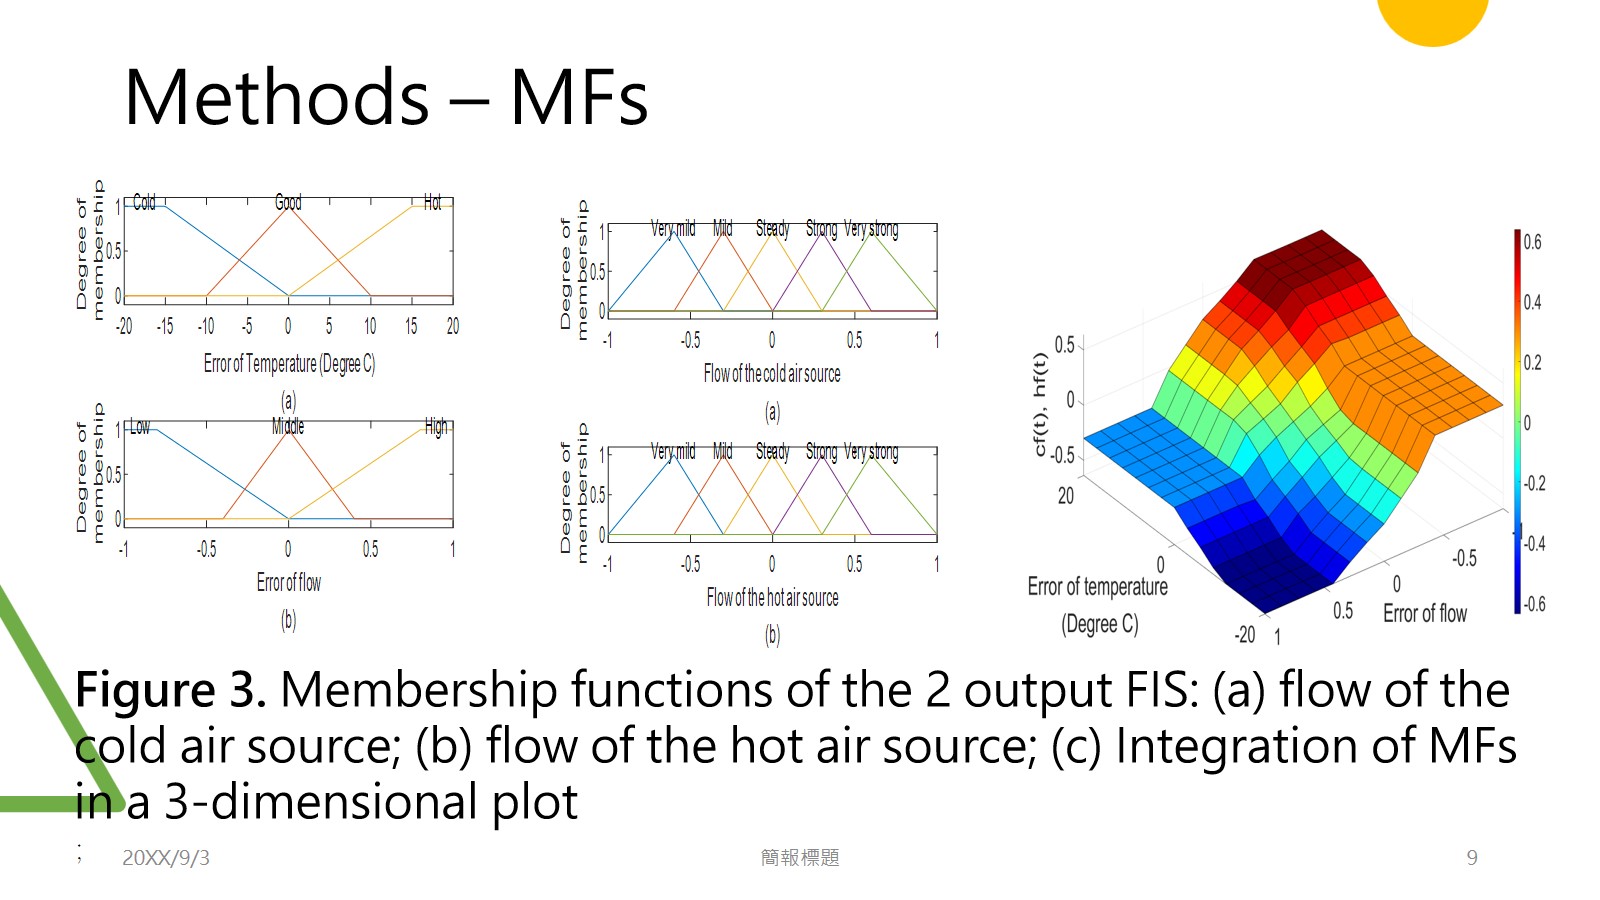 |
The membership functions (MFs) of the 2 inputs FIS were presented in Fig. 2. In (a), there were 3 states that were cold, good, and hot. They were defined by the error of the setpoint temperature between -20 and +20 degree C. The shapes of the MFs were all triangles. In (b), there were also 3 states that were low, middle, and high. They were defined by the error of the setpoint flow between -1 and +1. The shapes of the MFs were all triangles, too. All of the MFs are integrated in (c) [13-15]. |
| ICACT20230270 Slide.09
[Big Slide]
|
Chrome Click!! |
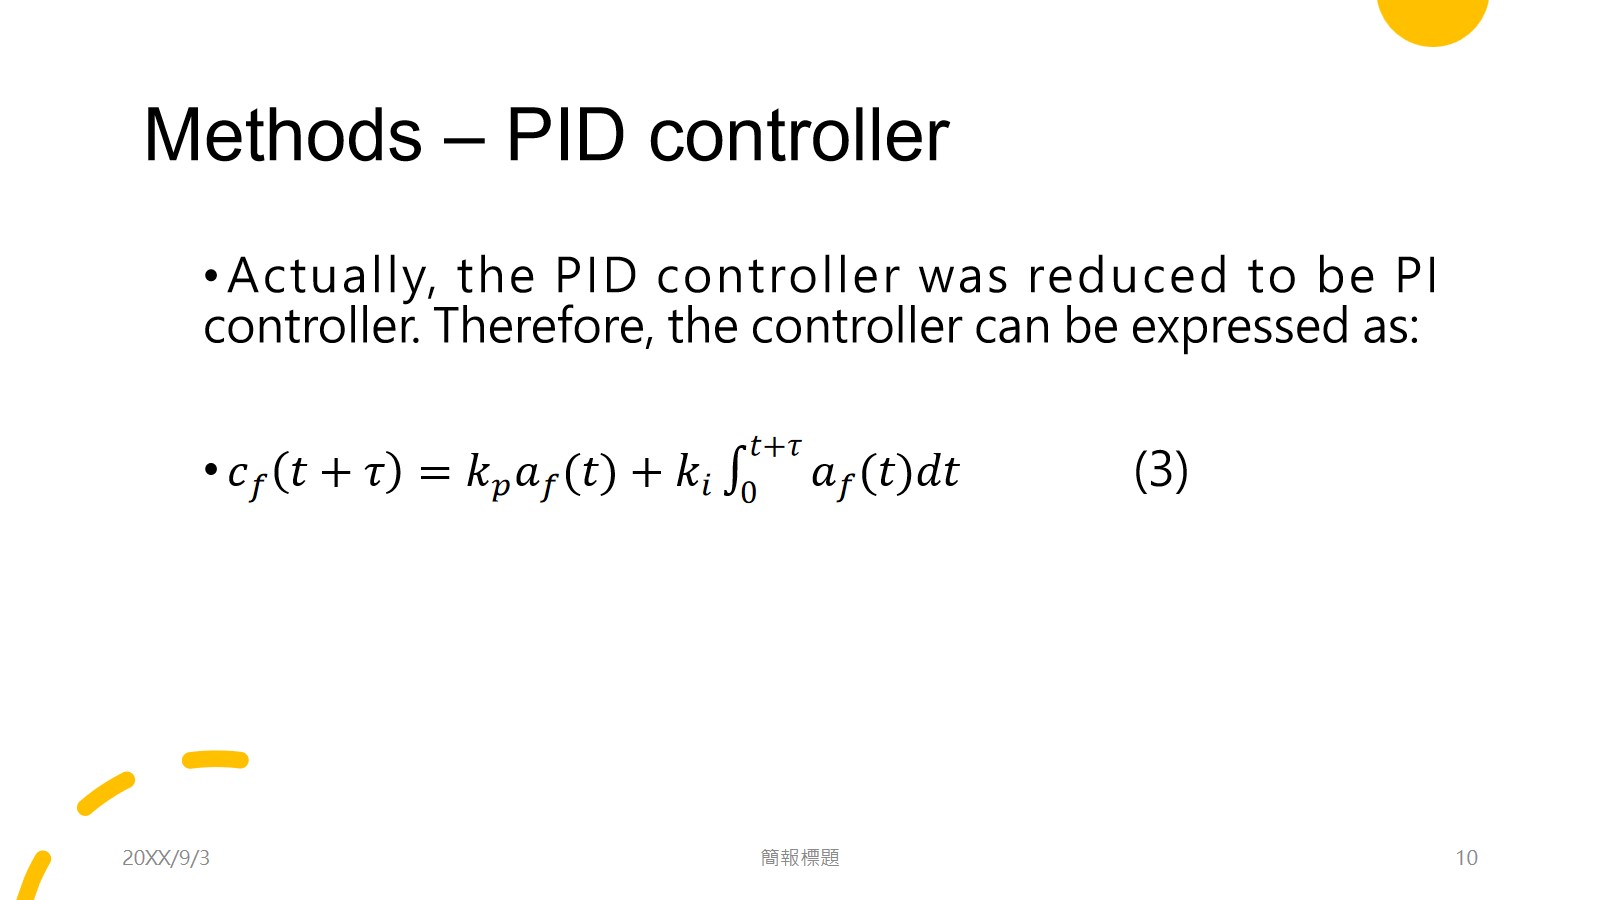 |
Methods – PID controller
Actually, the PID controller was reduced to be PI controller. Therefore, the controller can be expressed as:
𝑐_𝑓 (𝑡+𝜏)=𝑘_𝑝 𝑎_𝑓 (𝑡)+𝑘_𝑖 ∫1_0^(𝑡+𝜏)▒〖𝑎_𝑓 (𝑡)𝑑𝑡〗 (3)
|
| ICACT20230270 Slide.10
[Big Slide]
|
Chrome Click!! |
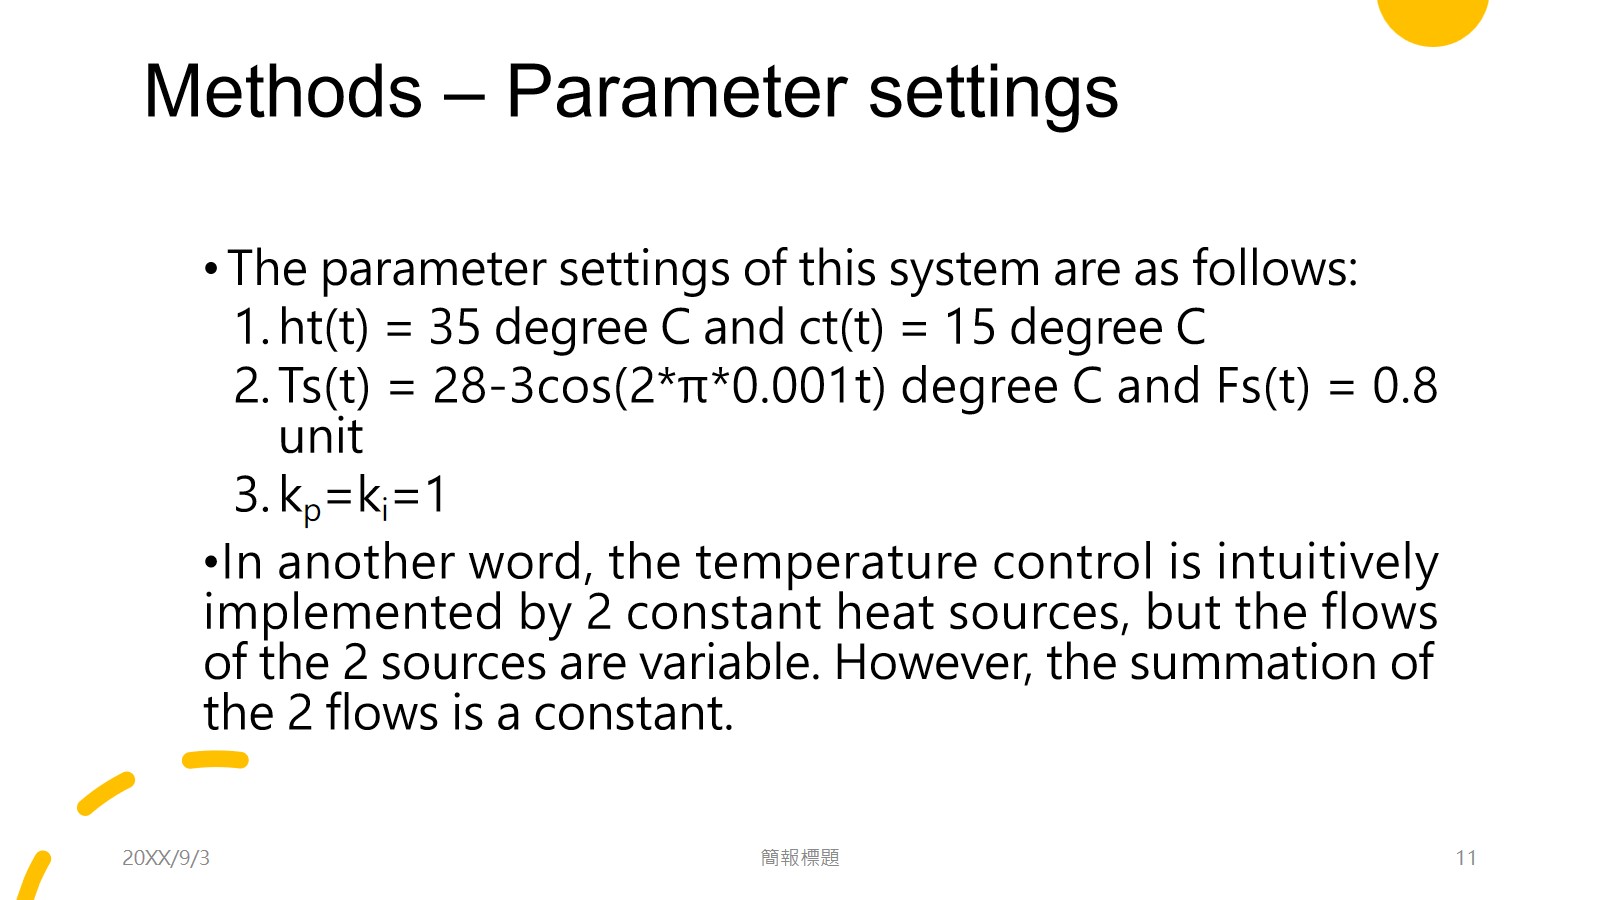 |
Methods – Parameter settings�
The parameter settings of this system are as follows:
ht(t) = 35 degree C and ct(t) = 15 degree C
Ts(t) = 28-3cos(2*π*0.001t) degree C and Fs(t) = 0.8 unit
kp=ki=1
In another word, the temperature control is intuitively implemented by 2 constant heat sources, but the flows of the 2 sources are variable. However, the summation of the 2 flows is a constant.
|
| ICACT20230270 Slide.12
[Big Slide]
|
Chrome Click!! |
 |
Results�
System structure
Transfer equation
FIS
PID control
Parameter settings
Equipment
|
| ICACT20230270 Slide.13
[Big Slide]
|
Chrome Click!! |
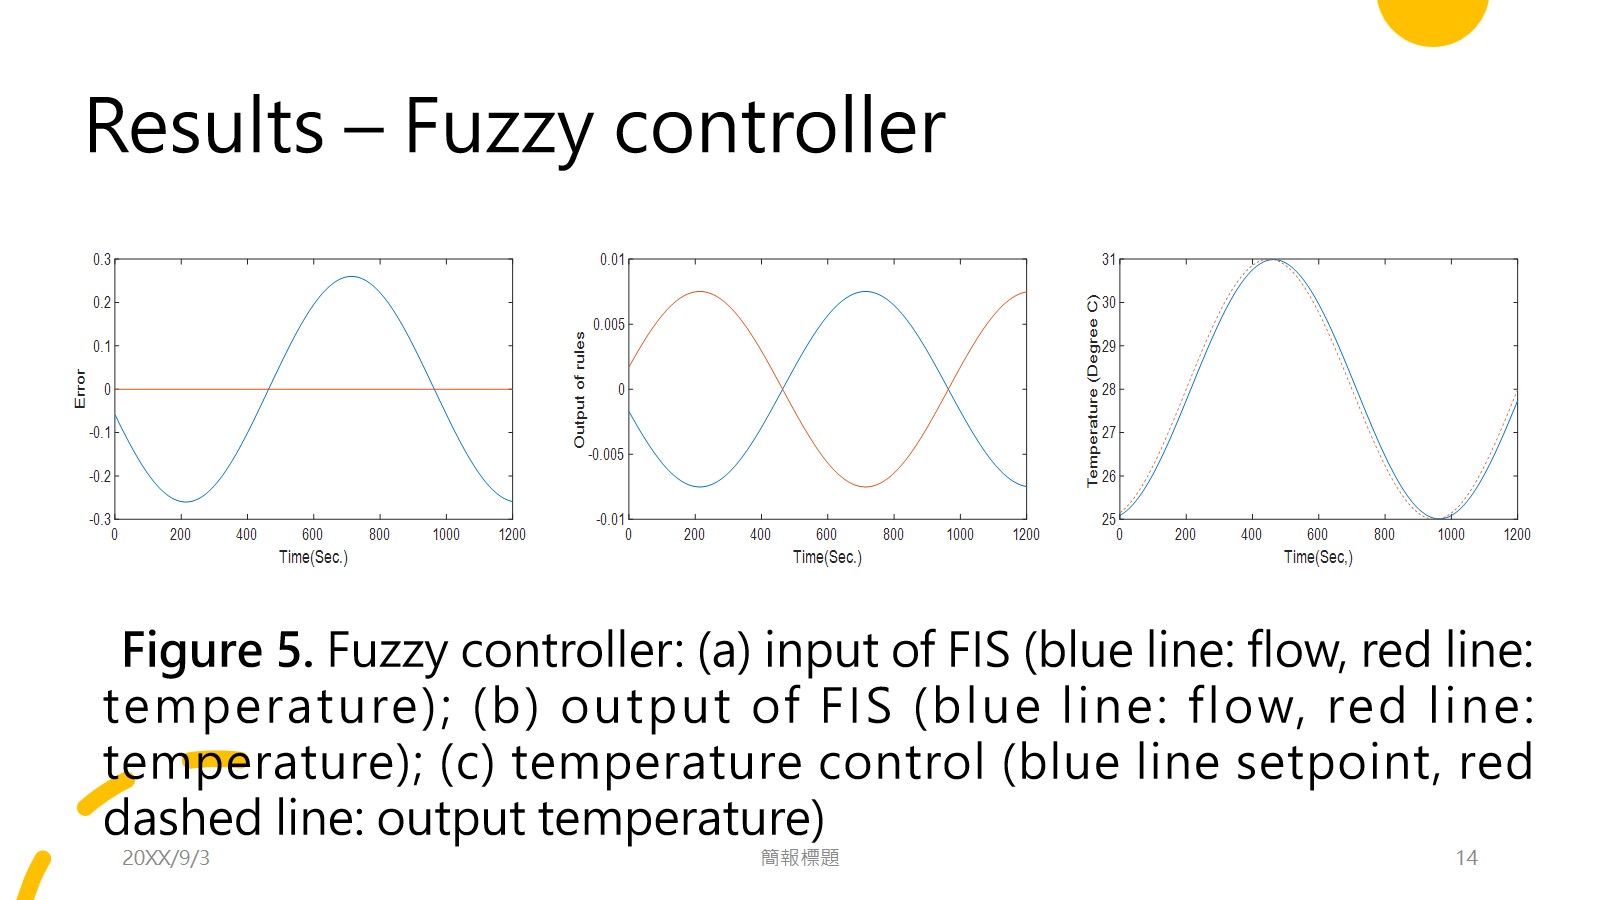 |
A. Fuzzy control
The controlled temperature of the fuzzy controller was presented in Fig. 5. In (a), the inputs (errors) of FIS were displayed. The blue line was flow and the red line was temperature. The output of FIS was presented in (b) where the blue line was flow and the red line was temperature. In (c), the controlled temperature was displayed in (c). the response needed to improve because of 25-second delay.
|
| ICACT20230270 Slide.14
[Big Slide]
|
Chrome Click!! |
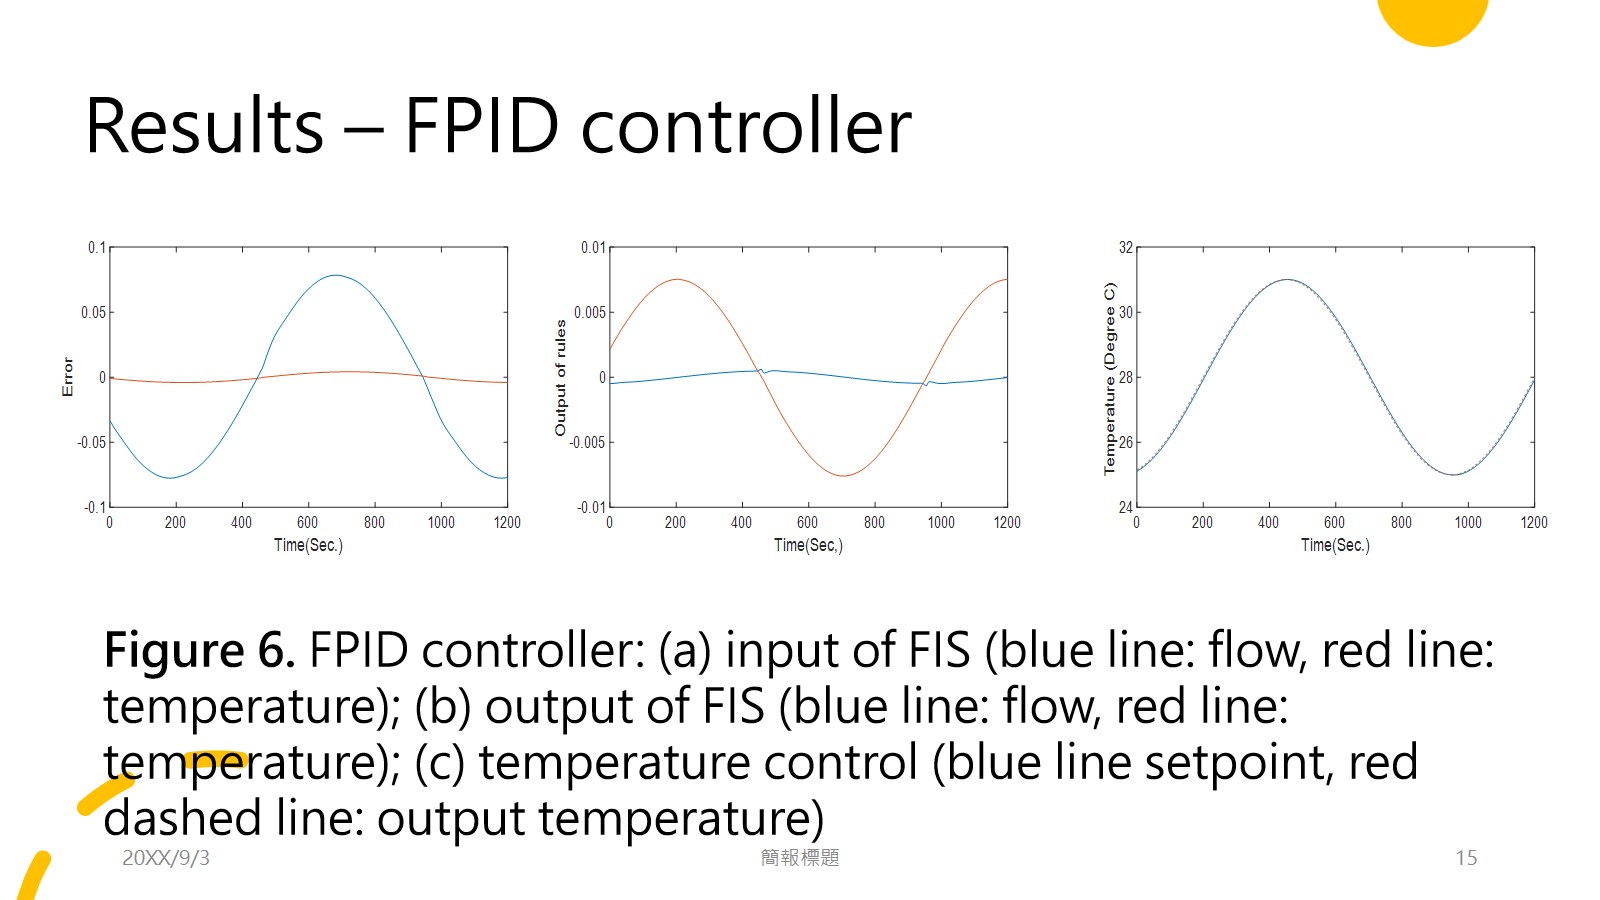 |
B. FPID control
Moreover, the controlled temperature of FPID controller was presented in Fig. 6. In (a), the inputs (errors) of FIS was displayed. The blue line was flow and the red line was temperature. The output of FIS was presented in (b) where the blue line was flow and the red line was temperature. In (c), the controlled temperature was displayed in (c), The response was better because the delay time was less than 2 seconds.
|
| ICACT20230270 Slide.15
[Big Slide]
|
Chrome Click!! |
 |
Discussion�
FPID control
Heating processes
|
| ICACT20230270 Slide.16
[Big Slide]
|
Chrome Click!! |
 |
Discussion
The performance of FPID was better than that of FIS-only because the response of delay time was much shorter. However, the FPID controller was not traditionally input by errors. It inputs the output of FIS. The PID controller actually served as an integrator of the output of FIS. Because the flow response is slow. The integrator works. Therefore, it can improve the delay.
|
| ICACT20230270 Slide.17
[Big Slide]
|
Chrome Click!! |
 |
Discussion
The setpoint of the temperature was designed to be a sine wave, because of the necessity of the phototherapy. The blue light is an energy. Therefore, the radiation of the blue light produced the heat. However, the higher temperature enhanced the effect of the blue light phototherapy. Therefore, the average temperature was set at 28-degree C. The phototherapy was working in the lower half-cycles and taking rests in the upper half-cycles for the thermal safety. The FPID supported a precise timing for therapy.
|
| ICACT20230270 Slide.18
[Big Slide]
|
Chrome Click!! |
 |
Conclusion�
|
| ICACT20230270 Slide.20
[Big Slide]
|
Chrome Click!! |
 |
Conclusuion
The phase control of upper and lower half-cycles enhances the safety of the infant’s treatment. Therefore, based on the simulation of this study, we are going to design and implement the real therapy system for the further study.
|
| ICACT20230270 Slide.21
[Big Slide]
|
Chrome Click!! |
 |
Thank you! |